What the page shows
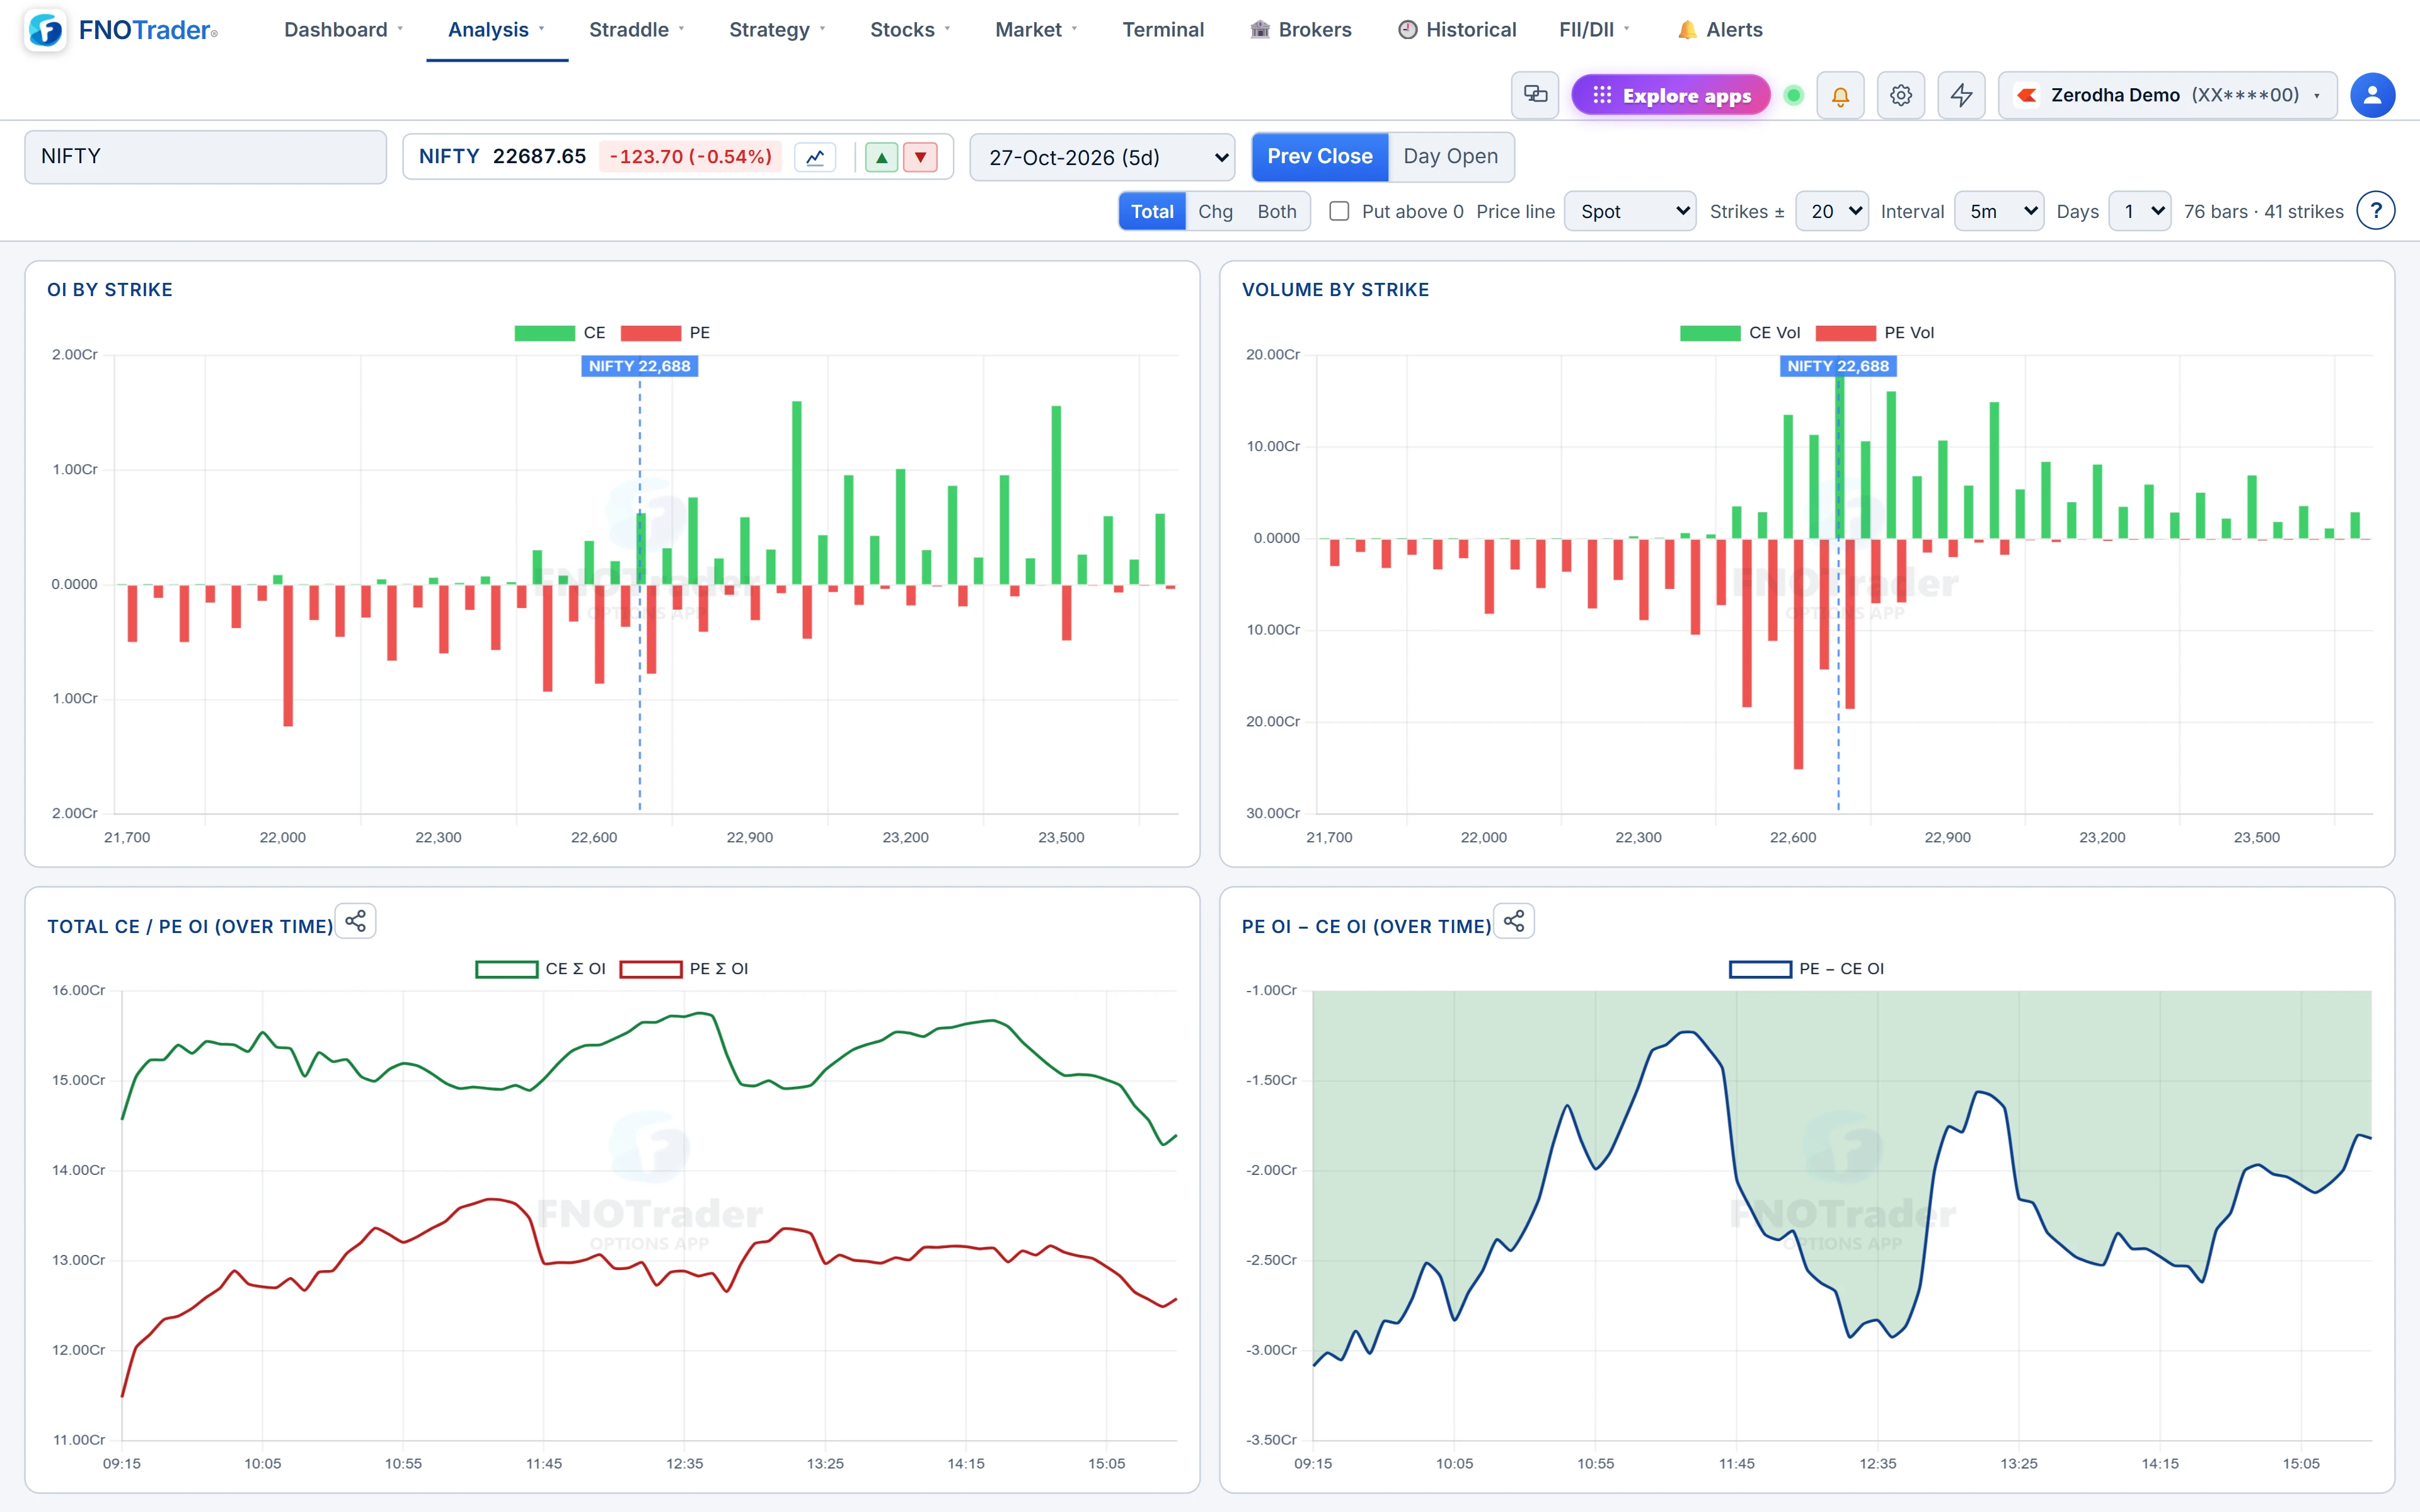
Two things: a snapshot of OI by strike, and the history of total call and put OI for the day.
The snapshot is the battle map. Tall call bars above price are calls that someone has written, usually read as resistance; tall put bars below price are written puts, usually read as support. The concept is covered in option chain analysis; this page makes it visible at a glance.
Total, Change and Both
| Mode | What the bar is |
|---|---|
| Total | Current open interest at each strike. |
| Chg | OI now minus OI at the previous session's close. |
| Both | A stacked bar: solid for OI carried from yesterday, hatched for OI added today, and a hollow segment for OI shed today. |
Calls are green and puts red on this page. By default puts are drawn below the zero line so the two sides read as a mirror; tick Put above 0 to group them side by side instead. Strikes ± sets how many strikes around ATM are drawn: 5, 10, 15, 20 (default), 30, 50 or All.
Note that OI change is always against the previous close, whatever you pick for the change basis elsewhere in the app, so Chg answers "what was added or removed since yesterday".
The price line: spot, future or synthetic
A vertical line marks the price across the strikes, interpolated between them so you can see exactly where it sits. You choose what it represents:
- Spot — the index or stock price.
- Future — the futures price.
- Synth.Fut — the synthetic future, ATM strike + CE price − PE price. This is calculated for NIFTY and SENSEX weekly expiries; elsewhere it falls back to the future.
The synthetic is the price the options themselves imply, carry included. On a weekly with a few days left, it can sit noticeably away from spot, and that gap decides which strike is really ATM.
Total OI over time, and the PE − CE gap
Below the snapshot, two charts show the session: total CE OI and total PE OI as two lines, and PE OI minus CE OI as a single line. Interval runs from 1 to 30 minutes (5 by default) over 1, 2 or 5 days. They sum OI over the strikes around the price (the strike range you set, up to ±20).
The gap line is the useful one. A rising PE − CE means puts are being added faster than calls — writers are more willing to sell downside than upside, the usual reading being support building under price. A falling line is the opposite. These two charts are drawn when the page loads; reload them to bring them up to date.
A worked example
Hypothetical NIFTY weekly at 10:00: total CE OI 4.2 crore, total PE OI 3.6 crore. PE − CE = −0.6 crore. PCR = 3.6 ÷ 4.2 = 0.86.
At 13:00: CE 4.5 crore, PE 4.4 crore. PE − CE = −0.1 crore, and PCR = 0.98. Calls added 0.3 crore; puts added 0.8 crore. The gap line has risen by 0.5 crore over three hours.
Switch the snapshot to Chg. If most of that 0.8 crore of put addition sits at one strike just under price, that strike is where the support story is concentrated — and where to watch for the opposite: puts being shed if price breaks it.
Common mistakes
OI is not direction. Every contract has a buyer and a seller. Reading tall call OI as "resistance" assumes the writers are the informed side, which is a convention, not a fact.
Walls move. A wall that is shed as price approaches was never a wall. Watch it in motion with OI Playback.
For buildup tags per strike, use the chain's buildup column or Options Buildup; this page shows OI only.
Where to find it
- In Options Analytics, open Analysis → Open Interest, or click the PCR, Max Pain or OI card on the chain.
- Choose Total, Chg or Both, and the price line.
- Set Strikes ±, then the interval and days for the time charts.
Common questions
What does change in OI compare against?
The previous session's closing open interest, for every strike.
What is the synthetic future on the OI chart?
ATM strike plus the call price minus the put price, the forward price implied by the options. It is calculated for NIFTY and SENSEX weeklies.
What does a rising PE minus CE OI line mean?
Puts are being added faster than calls across the strikes near price. It is commonly read as writers building support, though it is not a direction signal on its own.
Can I see puts and calls on the same side of the axis?
Yes. Tick Put above 0 to draw both sides above zero, grouped by strike.
More on Options App
More in Options App · App: Options Analytics · Definitions: glossary · All: every article