What IV and skew are
Implied volatility is the volatility that makes an option's model price equal its market price. It is the market's price for movement, in annualised percent.
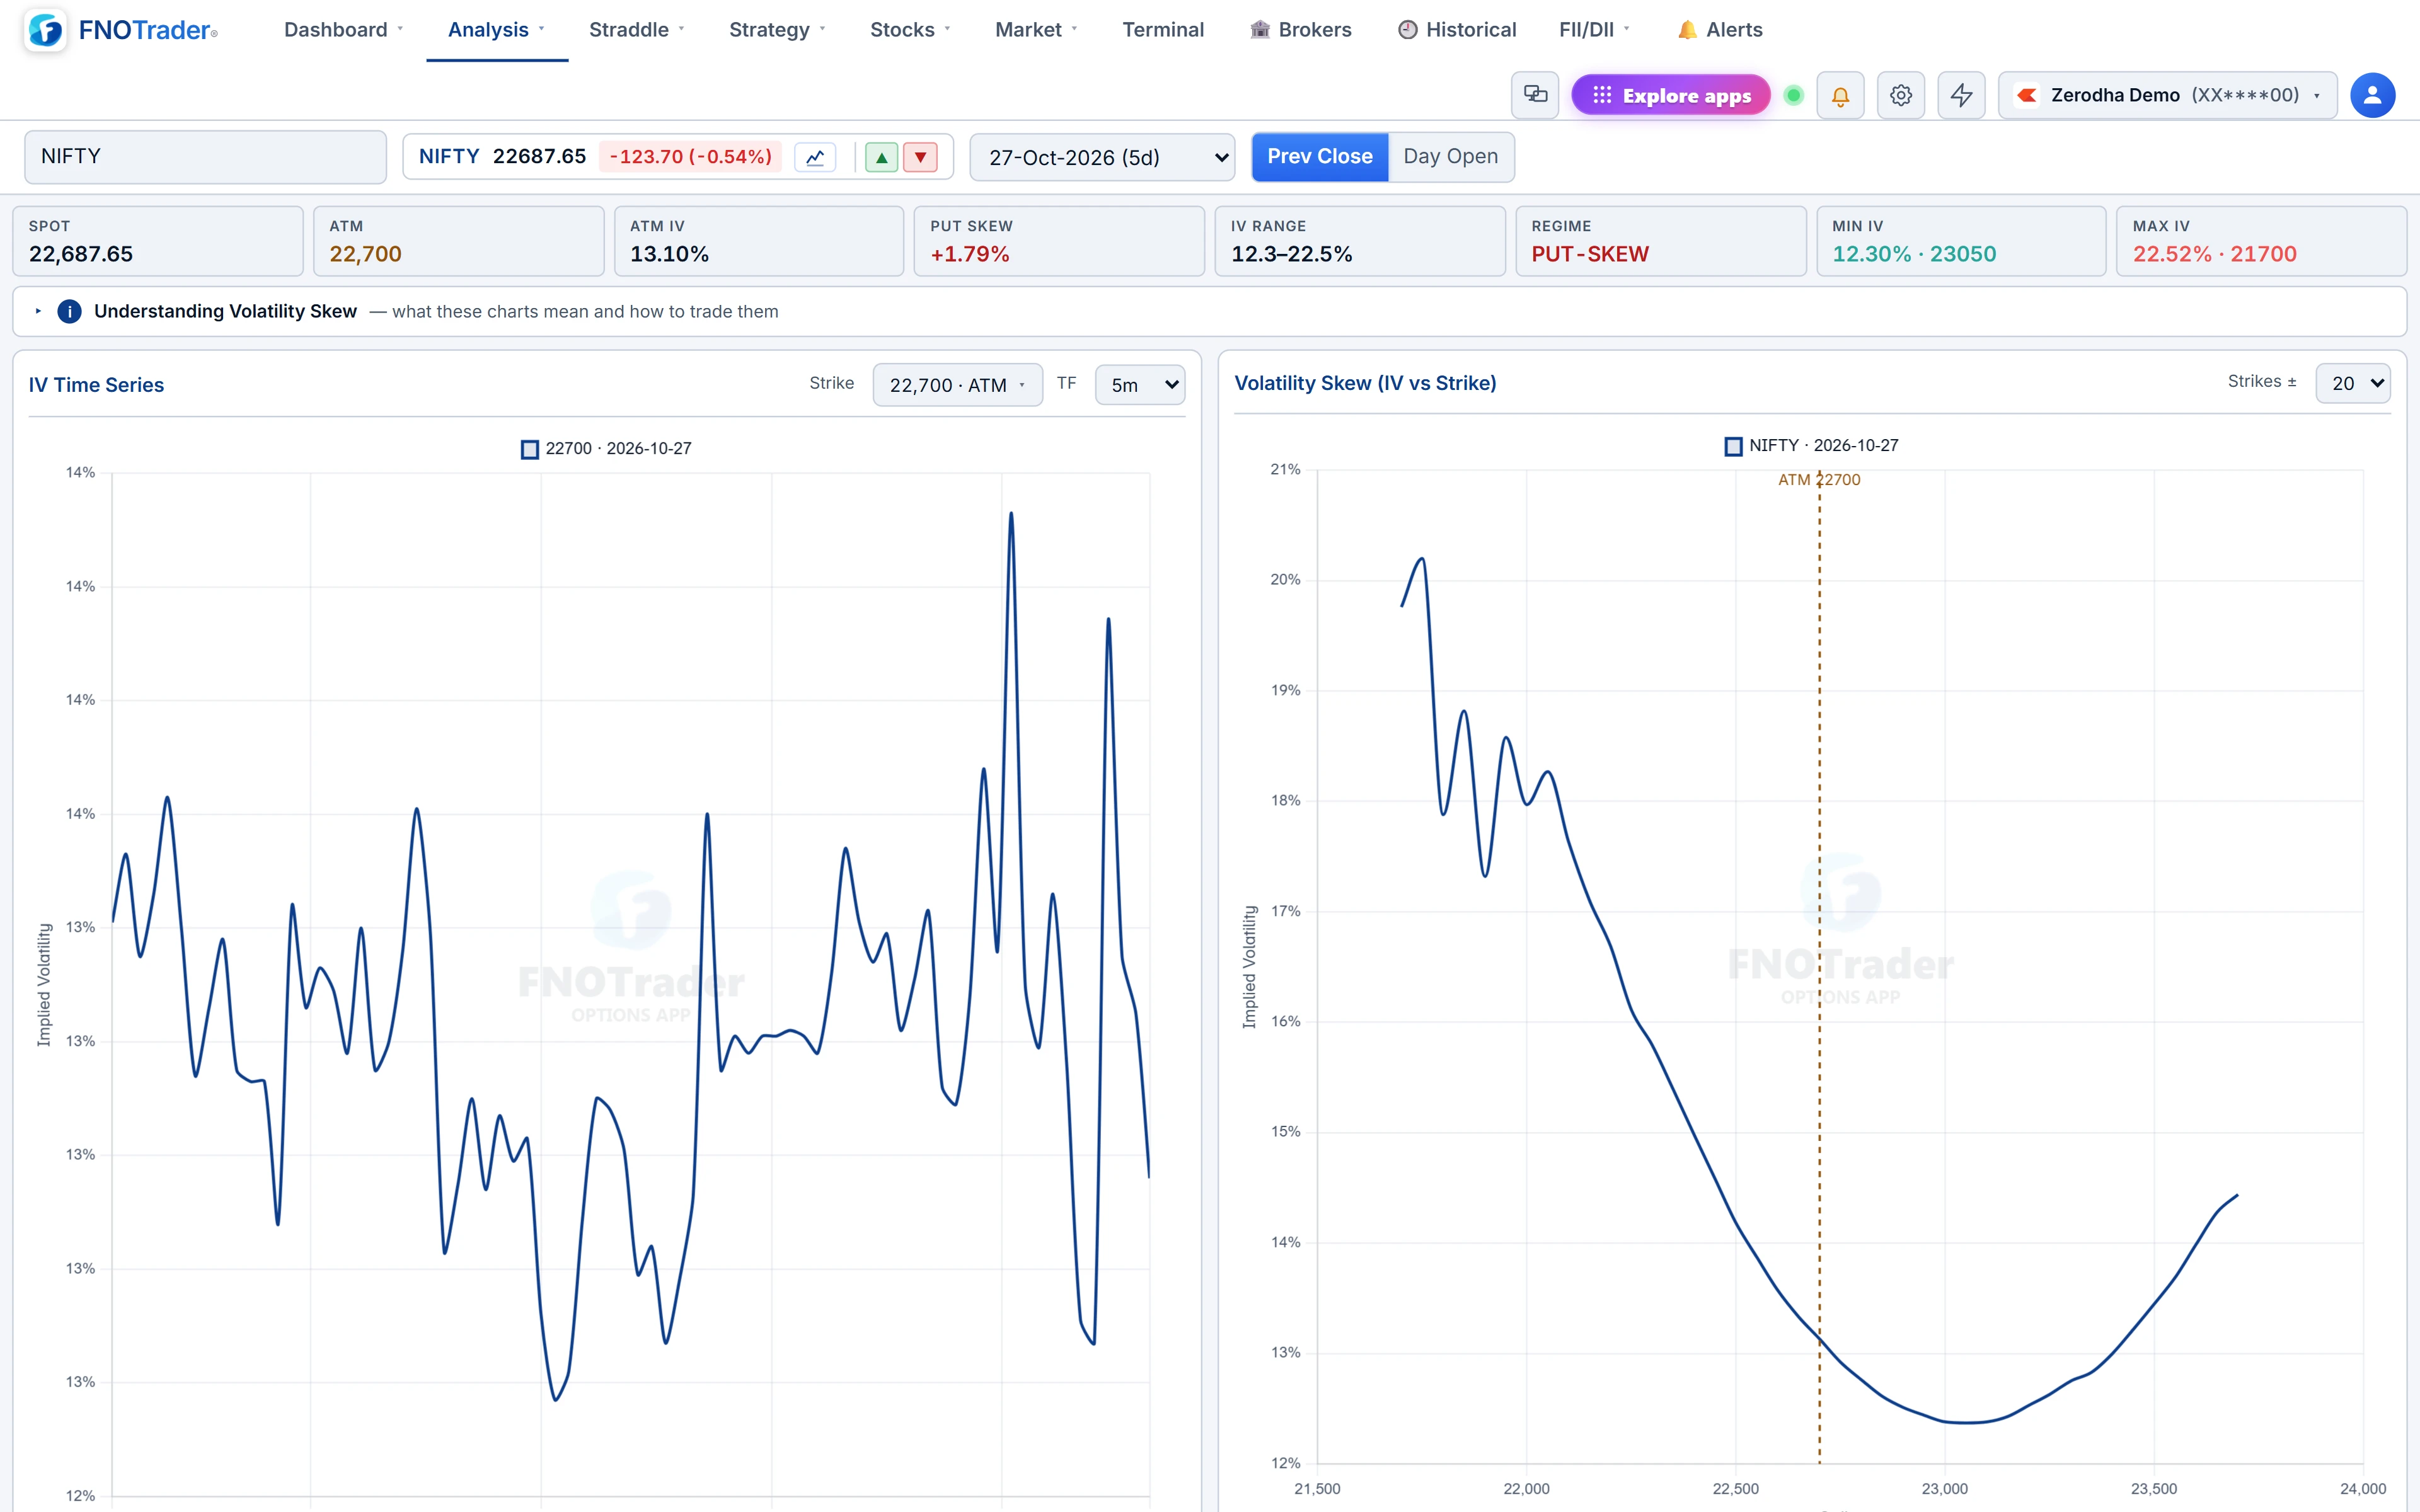
If every strike were priced off the same volatility, IV plotted across strikes would be a flat line. It is not. For Indian index options the usual shape is a put skew: OTM puts carry higher IV than OTM calls, because protection against a fall is in steady demand. A curve rising on both wings is a smile, often seen around events. Calls priced richer than puts — call skew — is rarer in indices and more common in single stocks during sharp rallies.
The two panes
| Pane | What it shows |
|---|---|
| IV Time Series | The IV of one strike's call through the day, on intervals from 1 to 30 minutes. Pick the strike from the dropdown; the ATM is marked. |
| Volatility Skew (IV vs Strike) | IV across strikes around ATM from the live chain, ±10, 20, 30 or 40 strikes. Smoothed with a 3-point moving average so illiquid strikes do not jag the curve. |
Both follow the symbol and expiry in the top bar. Change the expiry to compare weekly and monthly skew — a weekly IV well above monthly usually means a near-term event is priced in.
The summary numbers
| Stat | Meaning |
|---|---|
| ATM IV | IV at the strike closest to spot. |
| Put Skew | IV of the put nearest 95% of spot minus IV of the call nearest 105% of spot. Positive means downside is priced richer. |
| Regime | PUT-SKEW if put skew is above +0.5 vol points, CALL-SKEW if below −0.5, otherwise FLAT. |
| IV Range, Min IV, Max IV | Lowest and highest IV in the visible window, with their strikes. |
IVs above 150% are ignored in these numbers and the chart: deep OTM quotes on illiquid strikes sometimes imply absurd values that would flatten the rest of the curve.
A worked example
Hypothetical. NIFTY at 24,000. 95% of spot is 22,800 and 105% is 25,200.
- 22,800 PE IV: 17.4%. 25,200 CE IV: 12.9%.
- Put skew = 17.4 − 12.9 = +4.5 vol points, above +0.5, so the regime is PUT-SKEW.
- If a week later those read 15.1% and 14.8%, put skew is +0.3 and the tag becomes FLAT — the downside premium has come in relative to the upside.
The regime tag does not say which way the market is going. A steepening put skew is consistent with people buying protection; it is not proof of a fall.
Limits and common mistakes
- The time series charts the call leg only. By put–call parity the call and put at one strike should carry similar IV, but on illiquid strikes they can differ.
- The put-skew number uses one put and one call at fixed distances. It is a quick proxy, not the whole curve — look at the chart.
- The FLAT tag covers both a genuinely flat curve and a symmetric smile; the curve shows which.
- Skew near expiry can be dominated by a few illiquid quotes. See expiry day options.
Where to find it
- Options Analytics › Analysis › Volatility.
- Set symbol and expiry in the top bar.
- Pick a strike and timeframe for the IV Time Series.
- Set Strikes ± for the skew chart and read the stats strip.
To see how IV changes the price of a whole structure, try the IV what-if in the Strategy Builder.
Common questions
What is IV skew in NIFTY options?
The pattern of implied volatility across strikes. NIFTY usually shows a put skew, where OTM puts carry higher IV than OTM calls.
How is the put skew number calculated?
IV of the put nearest 95% of spot minus IV of the call nearest 105% of spot. Above +0.5 vol points is tagged PUT-SKEW, below −0.5 CALL-SKEW, otherwise FLAT.
Why are some strikes missing from the skew chart?
IVs above 150% are dropped, because illiquid deep OTM quotes can imply extreme values that distort the curve.
Does the IV time series use the call or the put?
The call leg at the chosen strike.
More on Options App
More in Options App · App: Options Analytics · Definitions: glossary · All: every article