What the builder does
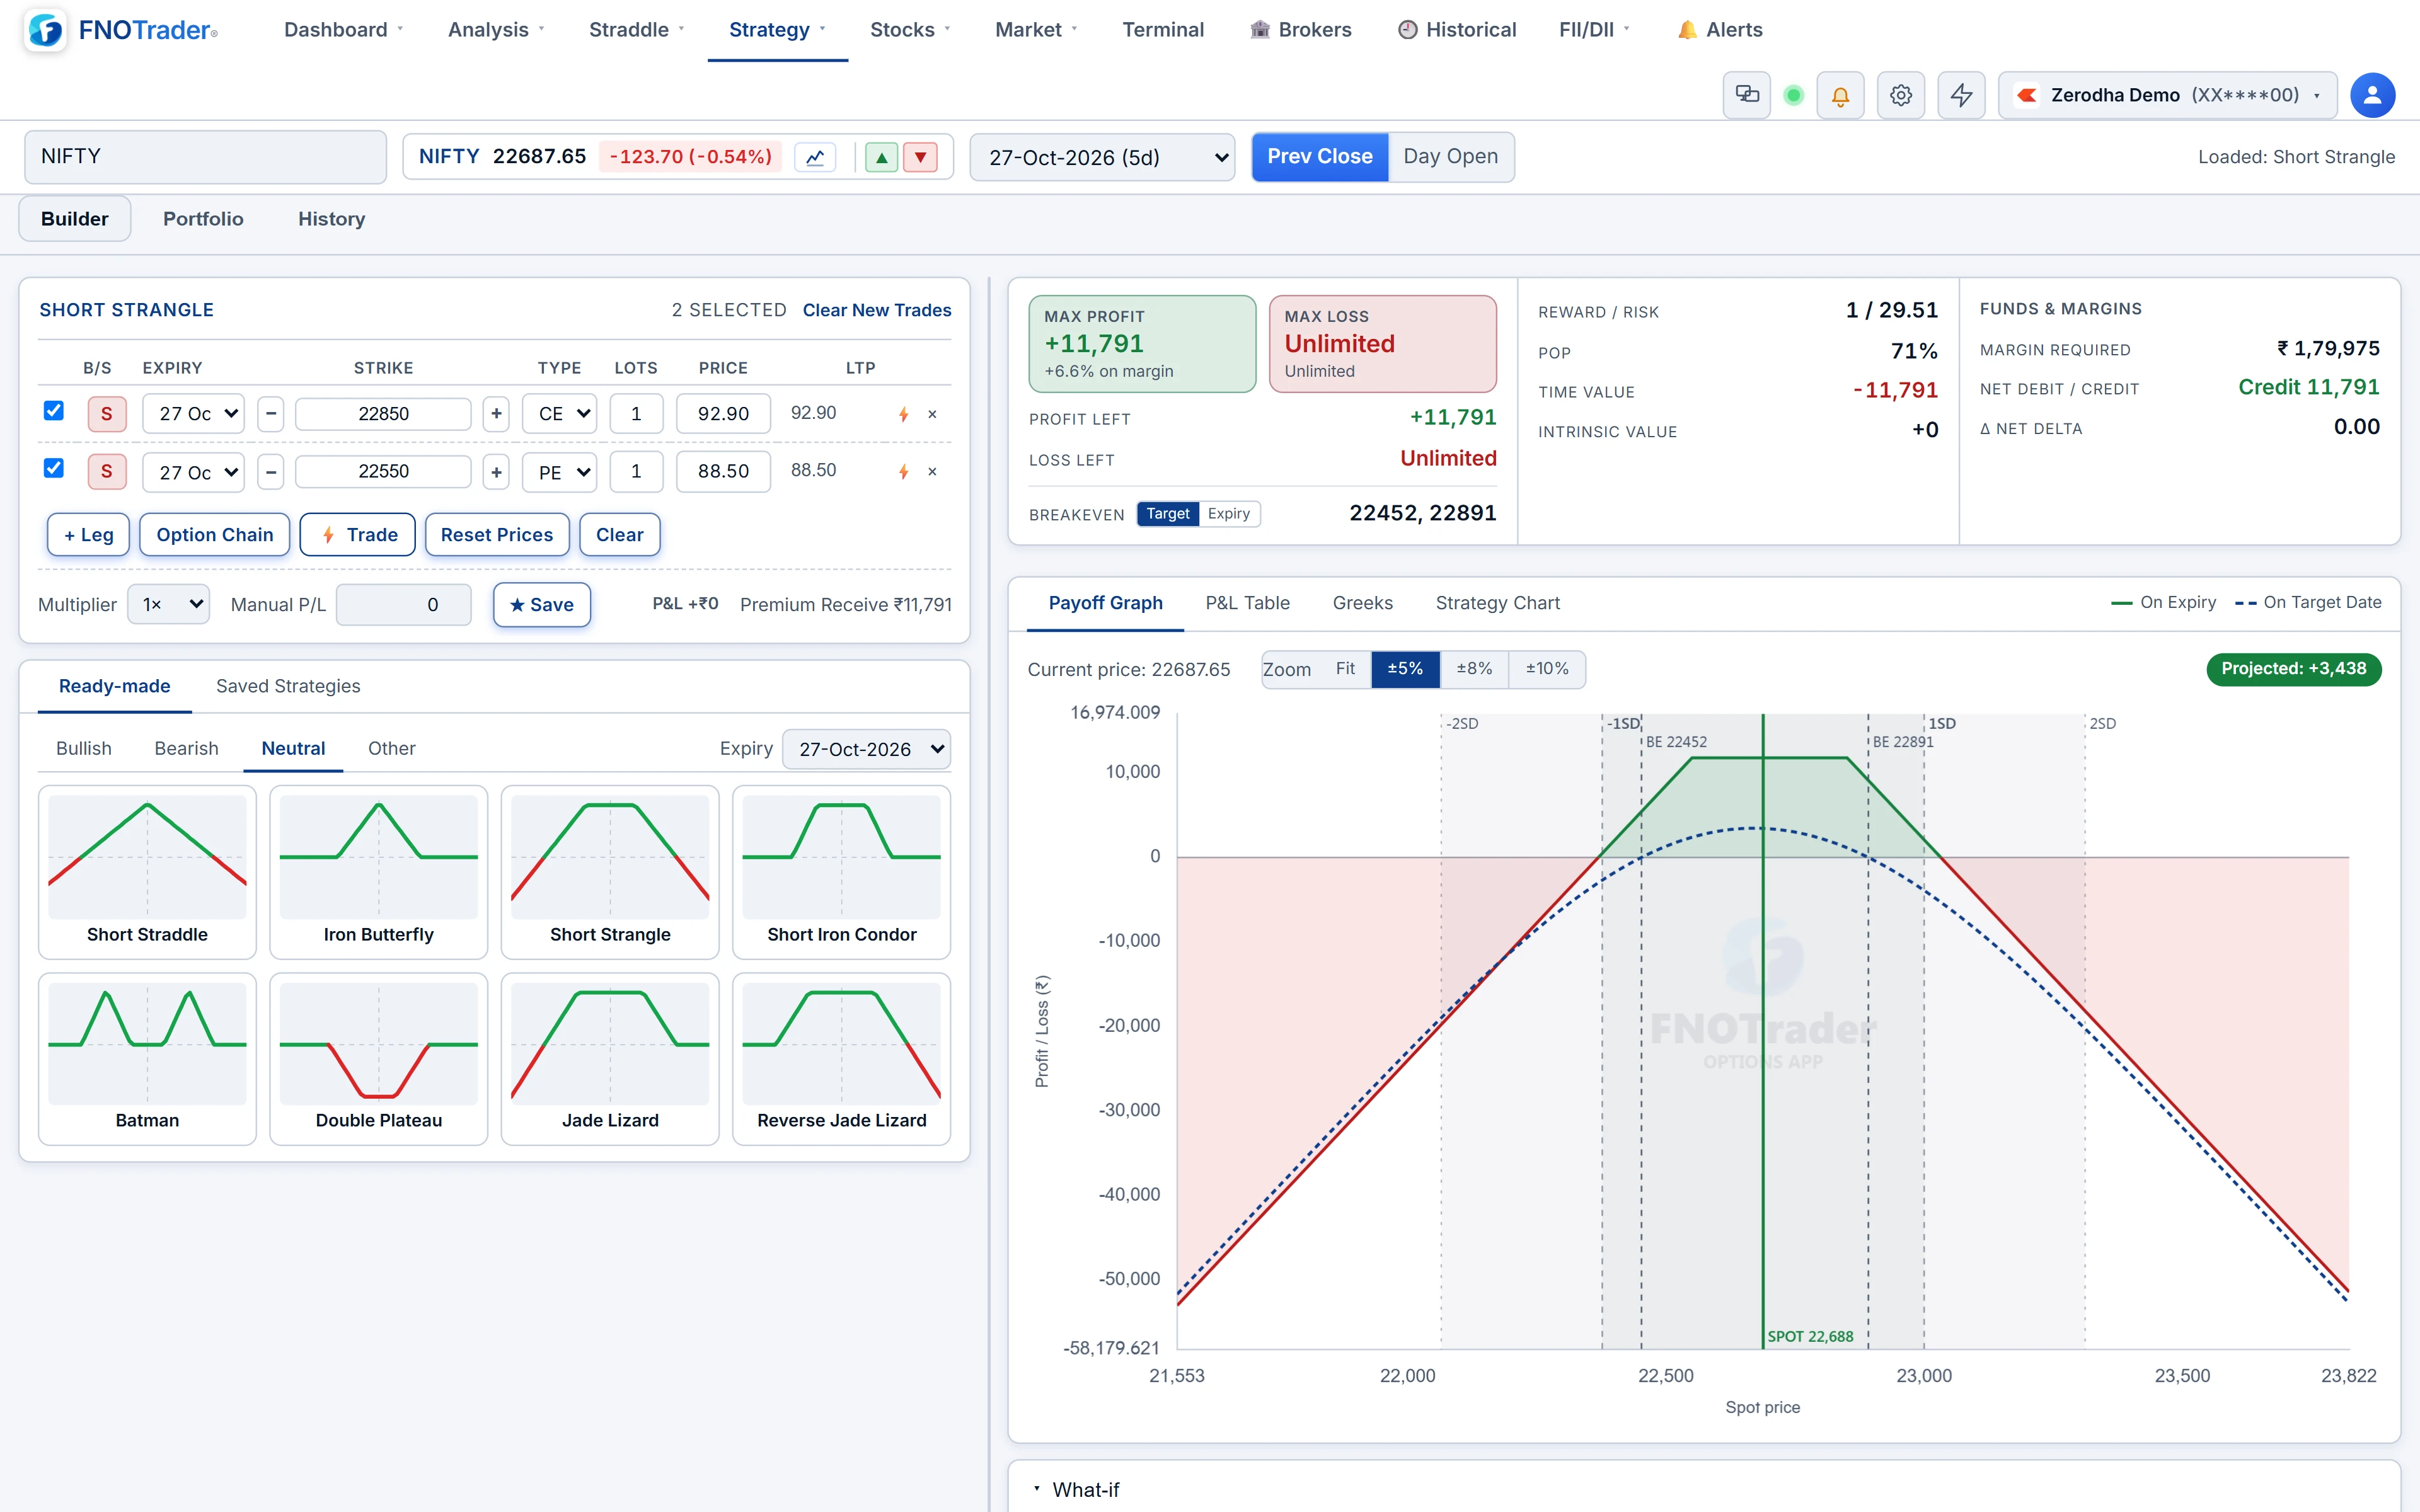
You describe a position as legs — buy or sell, call or put, strike, expiry, lots, price — and the builder values the combination.
Three ways to add legs:
- Manually, with + Leg. Each leg can have its own expiry, so calendars and diagonals work.
- Ready-made: 36 templates in four groups — 10 bullish, 10 bearish, 8 neutral, 8 other — built on the expiry you choose, with strikes set relative to ATM.
- Option Chain: open the chain inside the builder and click B or S on any strike.
A Multiplier of 1×, 2×, 3×, 5× or 10× scales every leg, to see a larger size without retyping lots. Strategies can be saved and reopened.
What it shows
| Output | What it is |
|---|---|
| Payoff graph | P&L across spot prices at expiry, and at a target date you choose. Zoom ±5%, 8%, 10% or Fit. |
| P&L table | The same payoff as numbers. |
| Greeks | Delta, gamma, theta, vega per leg and in total, optionally × lot size and × multiplier. |
| Max profit, max loss, R:R, breakevens | From a high-resolution sample of the expiry payoff, independent of chart zoom. |
| POP | Probability of profit at expiry (below). |
| Margin | The basket requirement, SPAN plus exposure, for the legs as a group. See SPAN margin explained. |
Target-date values price each leg with Black–Scholes for the time left. An IV what-if shifts implied volatility to see the payoff and POP under a different volatility.
How POP is computed
POP assumes spot at expiry is lognormally distributed, centred on today's spot, with volatility equal to the ATM IV (after any what-if shift) over the days left to the primary expiry. The builder walks the expiry payoff, finds every price range where it is positive, and adds up the probability of spot ending in those ranges.
That makes POP a model number. It ignores skew, assumes no drift and treats volatility as constant. For a structure whose profit depends on the wings, skew alone can move the true figure noticeably.
A worked example
Hypothetical short strangle. Spot 24,000, ATM IV 14%, 4 days to expiry, breakevens 23,500 and 24,500 — profit between them.
- σ√T = 0.14 × √(4/365) = 0.14 × 0.1047 = 0.01466.
- Upper: ln(24,500 / 24,000) = 0.02062; / 0.01466 = 1.41. Normal CDF = 0.920.
- Lower: ln(23,500 / 24,000) = −0.02105; / 0.01466 = −1.44. Normal CDF = 0.075.
- POP = 0.920 − 0.075 = 0.845, shown as 84%.
A high POP on a short strangle says the frequent outcome is a small gain. It says nothing about the size of the rare loss — that is what max loss and R:R are for.
Executing the structure
Trade places all legs on the account selected at the top right: the Demo account for practice, or a connected broker account for real orders. Legs are sent buy-first by default, so hedges are in place before short legs. If a whole leg fails — margin or otherwise — the default policy retries it once, then cancels or squares off the legs that did fill, so you are not left holding part of a structure. The legs land in the terminal as one grouped strategy.
Limits and common mistakes
- POP and max P&L are estimates from a model, not guarantees.
- The Multiplier scales real order quantity. Check it before placing a live trade.
- The payoff ignores costs, slippage and early assignment.
- All-or-nothing covers a leg failing, not a single order partially filling.
Where to find it
- Options Analytics › Strategy › Strategy Builder.
- Add legs with + Leg, a Ready-made template or Option Chain.
- Set the target date and any IV what-if; read the stats.
- Save it, or Trade to the Demo or broker account selected at the top right.
To watch the structure's combined premium through a session first, use the Strategy Chart. For range structures, see NIFTY range structures.
Common questions
How is probability of profit calculated in the Strategy Builder?
Spot at expiry is treated as lognormal around today's spot, using ATM IV over the days to expiry. POP is the total probability of spot ending where the expiry payoff is positive.
How many strategy templates are there?
36: 10 bullish, 10 bearish, 8 neutral and 8 other, built on the expiry you choose.
Does the builder show real margin?
Yes. It requests the basket margin, SPAN plus exposure, for all legs together, so hedged structures show their netted requirement.
What happens if one leg of my strategy fails?
By default the failed leg is retried once. If it still fails, the legs that executed are cancelled or squared off so you do not hold a partial strategy.
Can I practise without real money?
Yes. Select the Demo account at the top right and Trade places the legs as paper orders.
More on Options App
More in Options App · App: Options Analytics · Definitions: glossary · All: every article