What a rolling ATM straddle is
At every bar, take the strike nearest the underlying and add its call and put. Plot that sum, and keep doing it as the nearest strike changes.
The result is a synthetic instrument. No single contract trades at that price; it is the at-the-money premium of the chosen expiry, wherever the money happens to be. Because the strike follows spot, the series mostly reflects implied volatility and time to expiry rather than direction.
That makes it the right chart for questions like "has ATM premium been grinding lower all week" or "was today's expansion bigger than yesterday's". A fixed-strike straddle chart cannot answer either once spot has moved a few strikes.
Reading the page
The page has two panes, side by side or stacked: the Underlying and the ATM Straddle. Each pane has its own timeframe (1m to 30m, or 1d), its own history (1 day up to 1 year) and its own chart type (candle, line, mountain, baseline), so you can put daily candles of the straddle next to a 5-minute underlying.
- Straddle candles getting lower day after day, with small ranges, describe a steady short-volatility regime.
- A single wide candle expansion marks a volatility pop. The Underlying pane shows whether a price move caused it.
- Overlays include VWAP, EMA10, EMA20 and SuperTrend, plus futures and synthetic-futures lines on the underlying.
Below the panes, a live straddle table lists strike, CE, PE and straddle prices for the selected symbol and expiry, with the ATM row following spot.
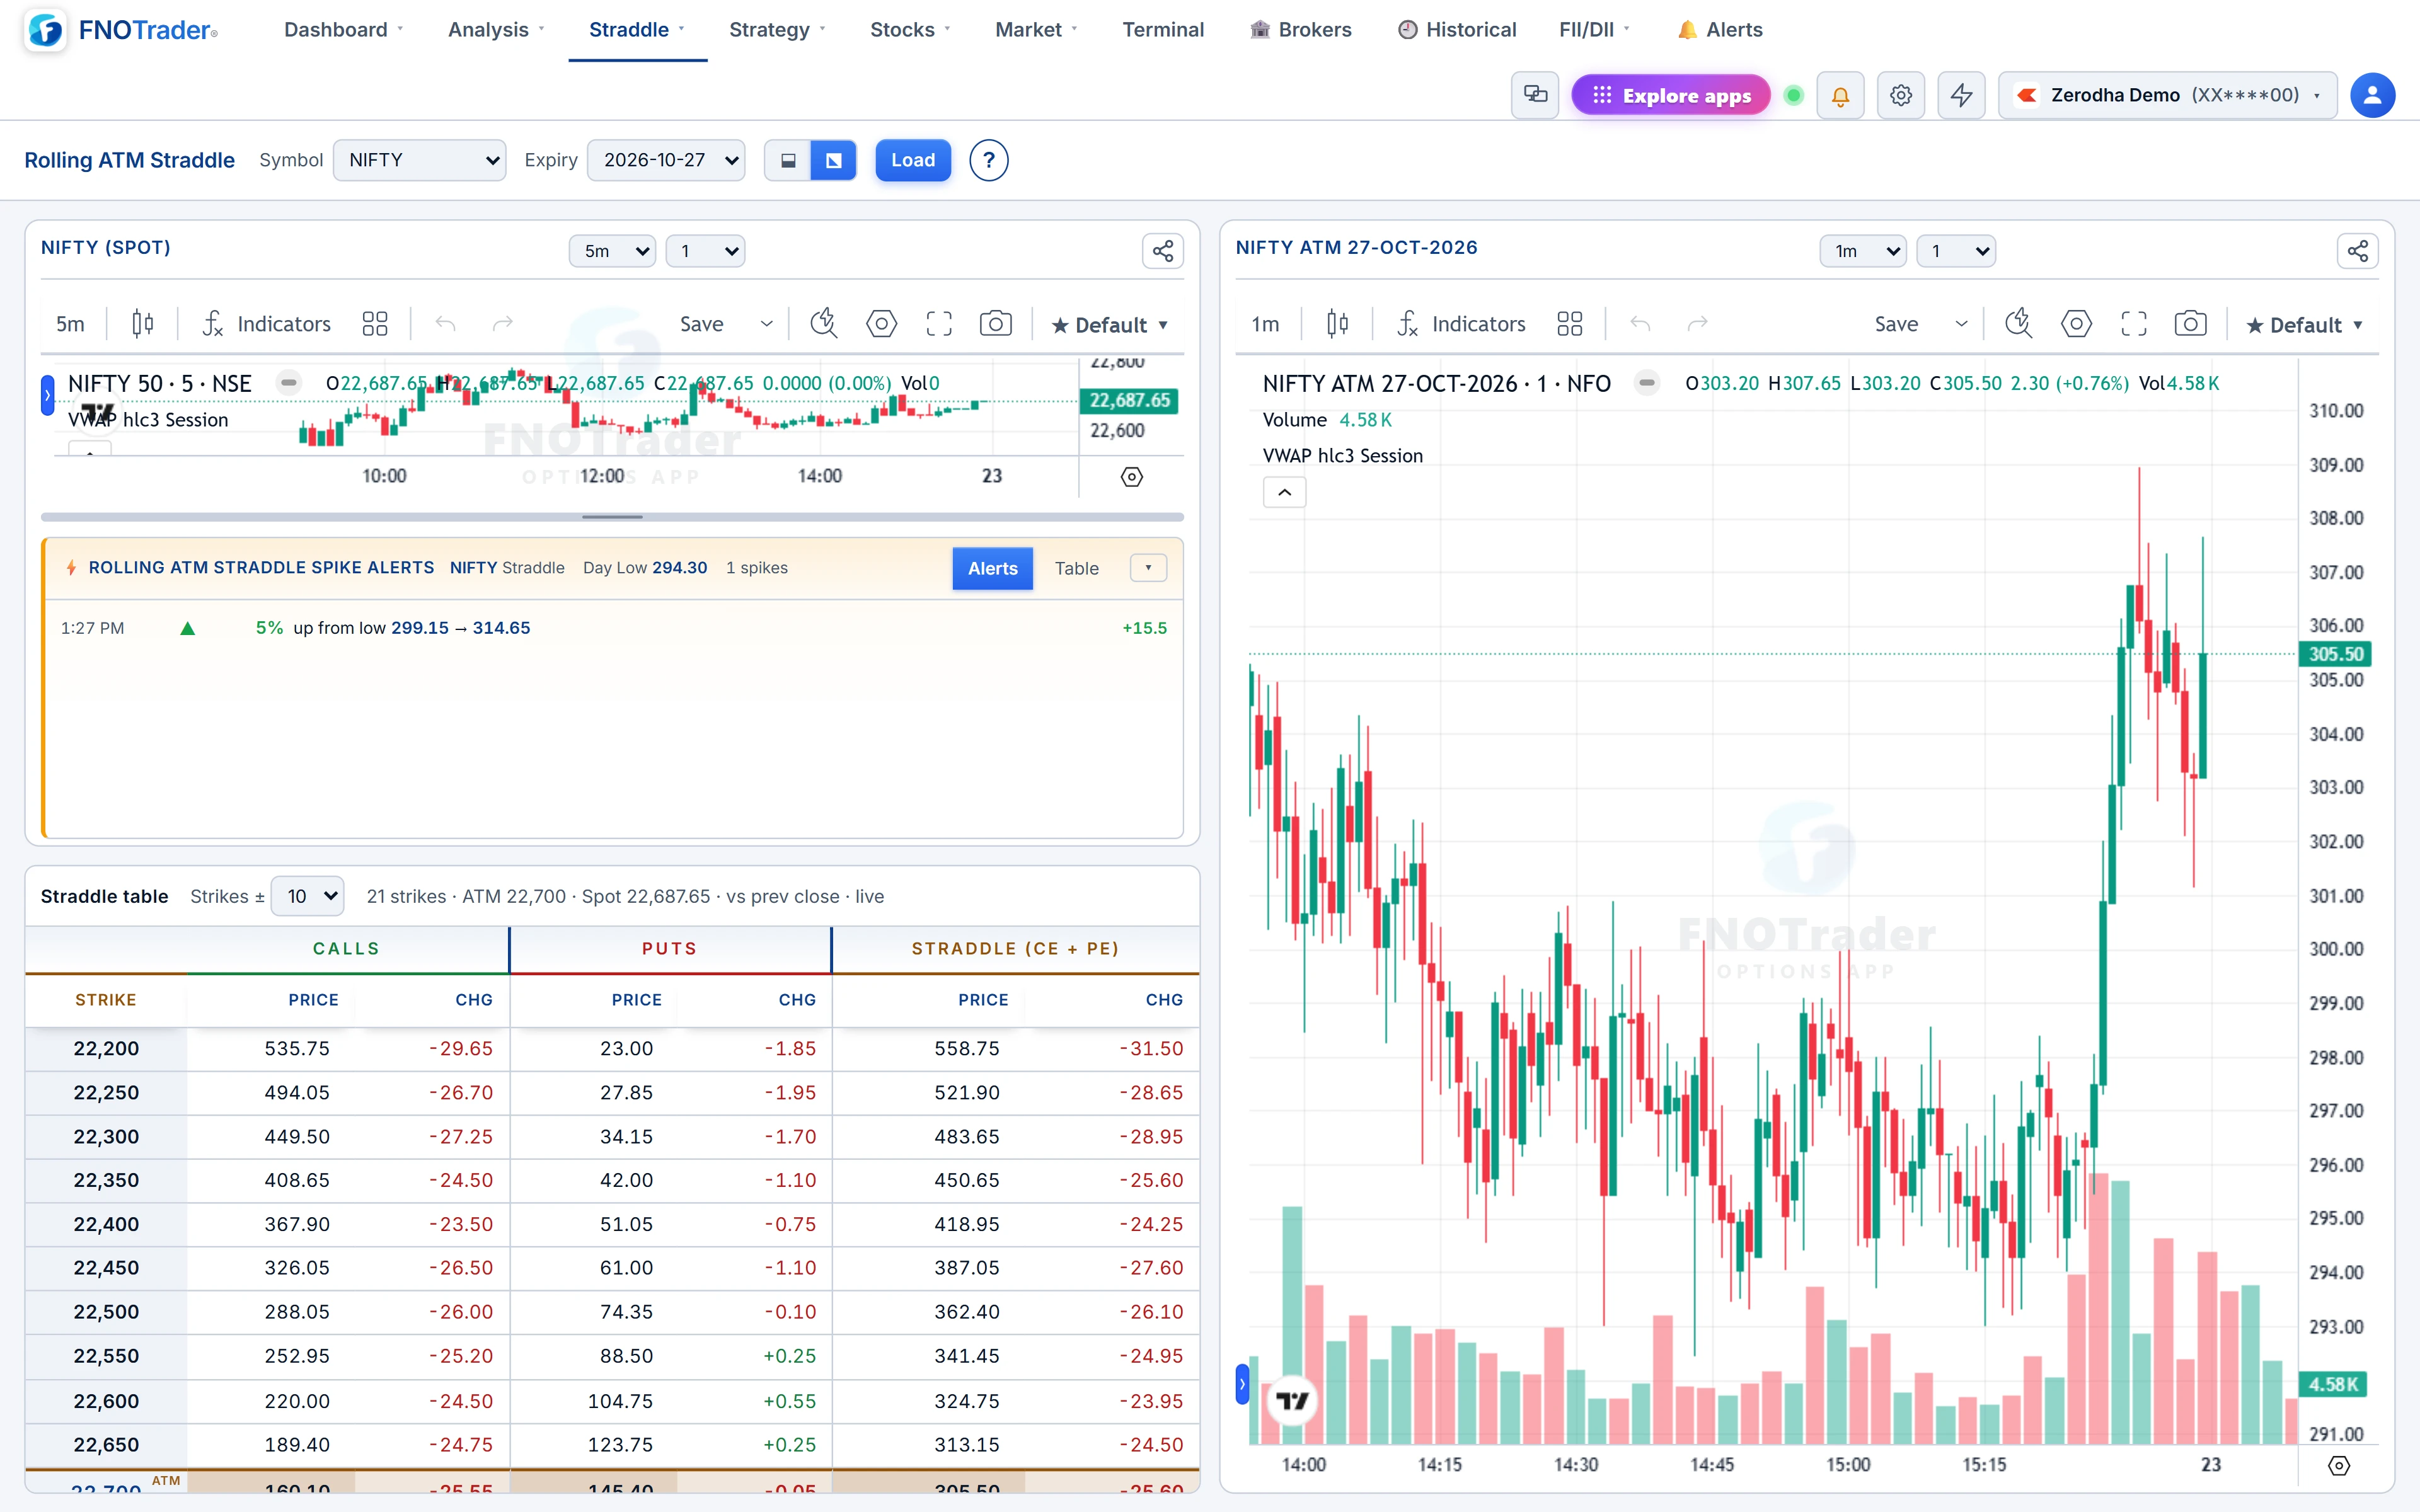
Spike% levels and spike alerts
The ATM premium usually makes its low some time after the open and then either drifts or jumps. The page anchors on that low.
- Day low. The 09:16 IST bar's close is the starting baseline; from 09:17 the running low of closes is tracked. The first minute is skipped because the open print is noisy.
- Spike% lines. Pick any of 5, 10, 15, 20, 30, 40, 50 or 100%. Each draws a dotted line at running day low × (1 + L%), stepping down whenever a new low is made.
- Spike alerts (NIFTY and SENSEX). An alert fires each time the premium closes 5%, 10%, 15% and so on above the day's low. A fresh low resets the ladder, so rises from the new low can alert again. The panel replays the last session's alerts and runs live ones during the session, with a Table view alongside.
The Spike% overlay is part of the standard chart engine; with the advanced chart engine selected in Settings, its own toolbar handles styles and indicators instead.
A worked example
Hypothetical NIFTY session, 1-minute bars:
- 09:16 close ₹210. Baseline and day low: ₹210.
- 10:40 the premium closes at ₹180, a new low. The alert ladder resets. The 10% line now sits at ₹180 × 1.10 = ₹198.
- 11:05 close ₹189: that is (189 − 180) / 180 = 5% above the low, so the 5% alert fires.
- 11:20 close ₹199: 10.6% above the low. The 10% alert fires and the close is above the 10% line.
- If the premium then falls to ₹176, that is a new low, the ladder resets again, and the next 5% alert needs ₹184.80.
Limits and common mistakes
- The rolling series is not tradable as one order. Each time ATM changes, holding "the ATM straddle" would mean closing one straddle and opening another, with costs and slippage the chart does not show.
- Premium falls into expiry by construction. Compare sessions at similar days to expiry, or use Straddle Insights, which does that for you.
- A spike alert is a measurement, not an instruction. A 20% rise from the low on expiry day can be a few rupees.
- On MCX the ATM follows the contract-month future, and holiday morning sessions can show long flat stretches before trading starts.
Where to find it
- Open Options Analytics › Straddle › Rolling ATM Straddle.
- Pick the Symbol — NIFTY, SENSEX, BANKNIFTY or an MCX commodity such as GOLD, SILVER, CRUDEOIL or NATURALGAS — and the Expiry.
- Set each pane's timeframe, days and chart type; choose the layout.
- Open Spike% to add level lines, then Load.
For the fixed-strike version of the same idea, see Straddle Charts OHLC.
Common questions
What is a rolling ATM straddle?
It is the call plus put premium at whichever strike is nearest the underlying at each bar. Because the strike follows spot, the series reflects the at-the-money premium rather than one contract.
How is a rolling ATM straddle different from a normal straddle chart?
A normal straddle chart stays on one strike, so it becomes directional once spot moves away. The rolling version re-centres, so it tracks the volatility regime across days.
How are the spike levels calculated?
From the running day low of the ATM premium, starting from the 09:16 IST close. Each level is day low × (1 + L%), and moves down whenever a new low is made.
Which symbols have spike alerts?
Spike alerts run for NIFTY and SENSEX. The chart itself covers NIFTY, SENSEX, BANKNIFTY and MCX commodities.
Can I backtest a rolling ATM straddle?
This page charts it and replays the last session's spike alerts. For full strategy backtests use the Algo app; see /blog/options-backtesting-india.
More on Options App
More in Options App · App: Options Analytics · Definitions: glossary · All: every article