The problem with judging a straddle by eye
A straddle's price depends heavily on two things that have nothing to do with whether it is cheap: days to expiry and the level of the index.
A NIFTY straddle four days from expiry is always several times the expiry-day straddle — that is time, not richness. And a ₹200 straddle means something different with the index at 20,000 than at 25,000. Comparing today's number with "usual" without fixing those two is how a normal premium gets called expensive.
Straddle Insights fixes both. It groups past sessions by underlying (NIFTY or SENSEX), by weekly or monthly expiry, and by days to expiry from 0 to 4, and it measures the straddle as a percentage of spot at each 15-minute mark of the session.
What is on the page
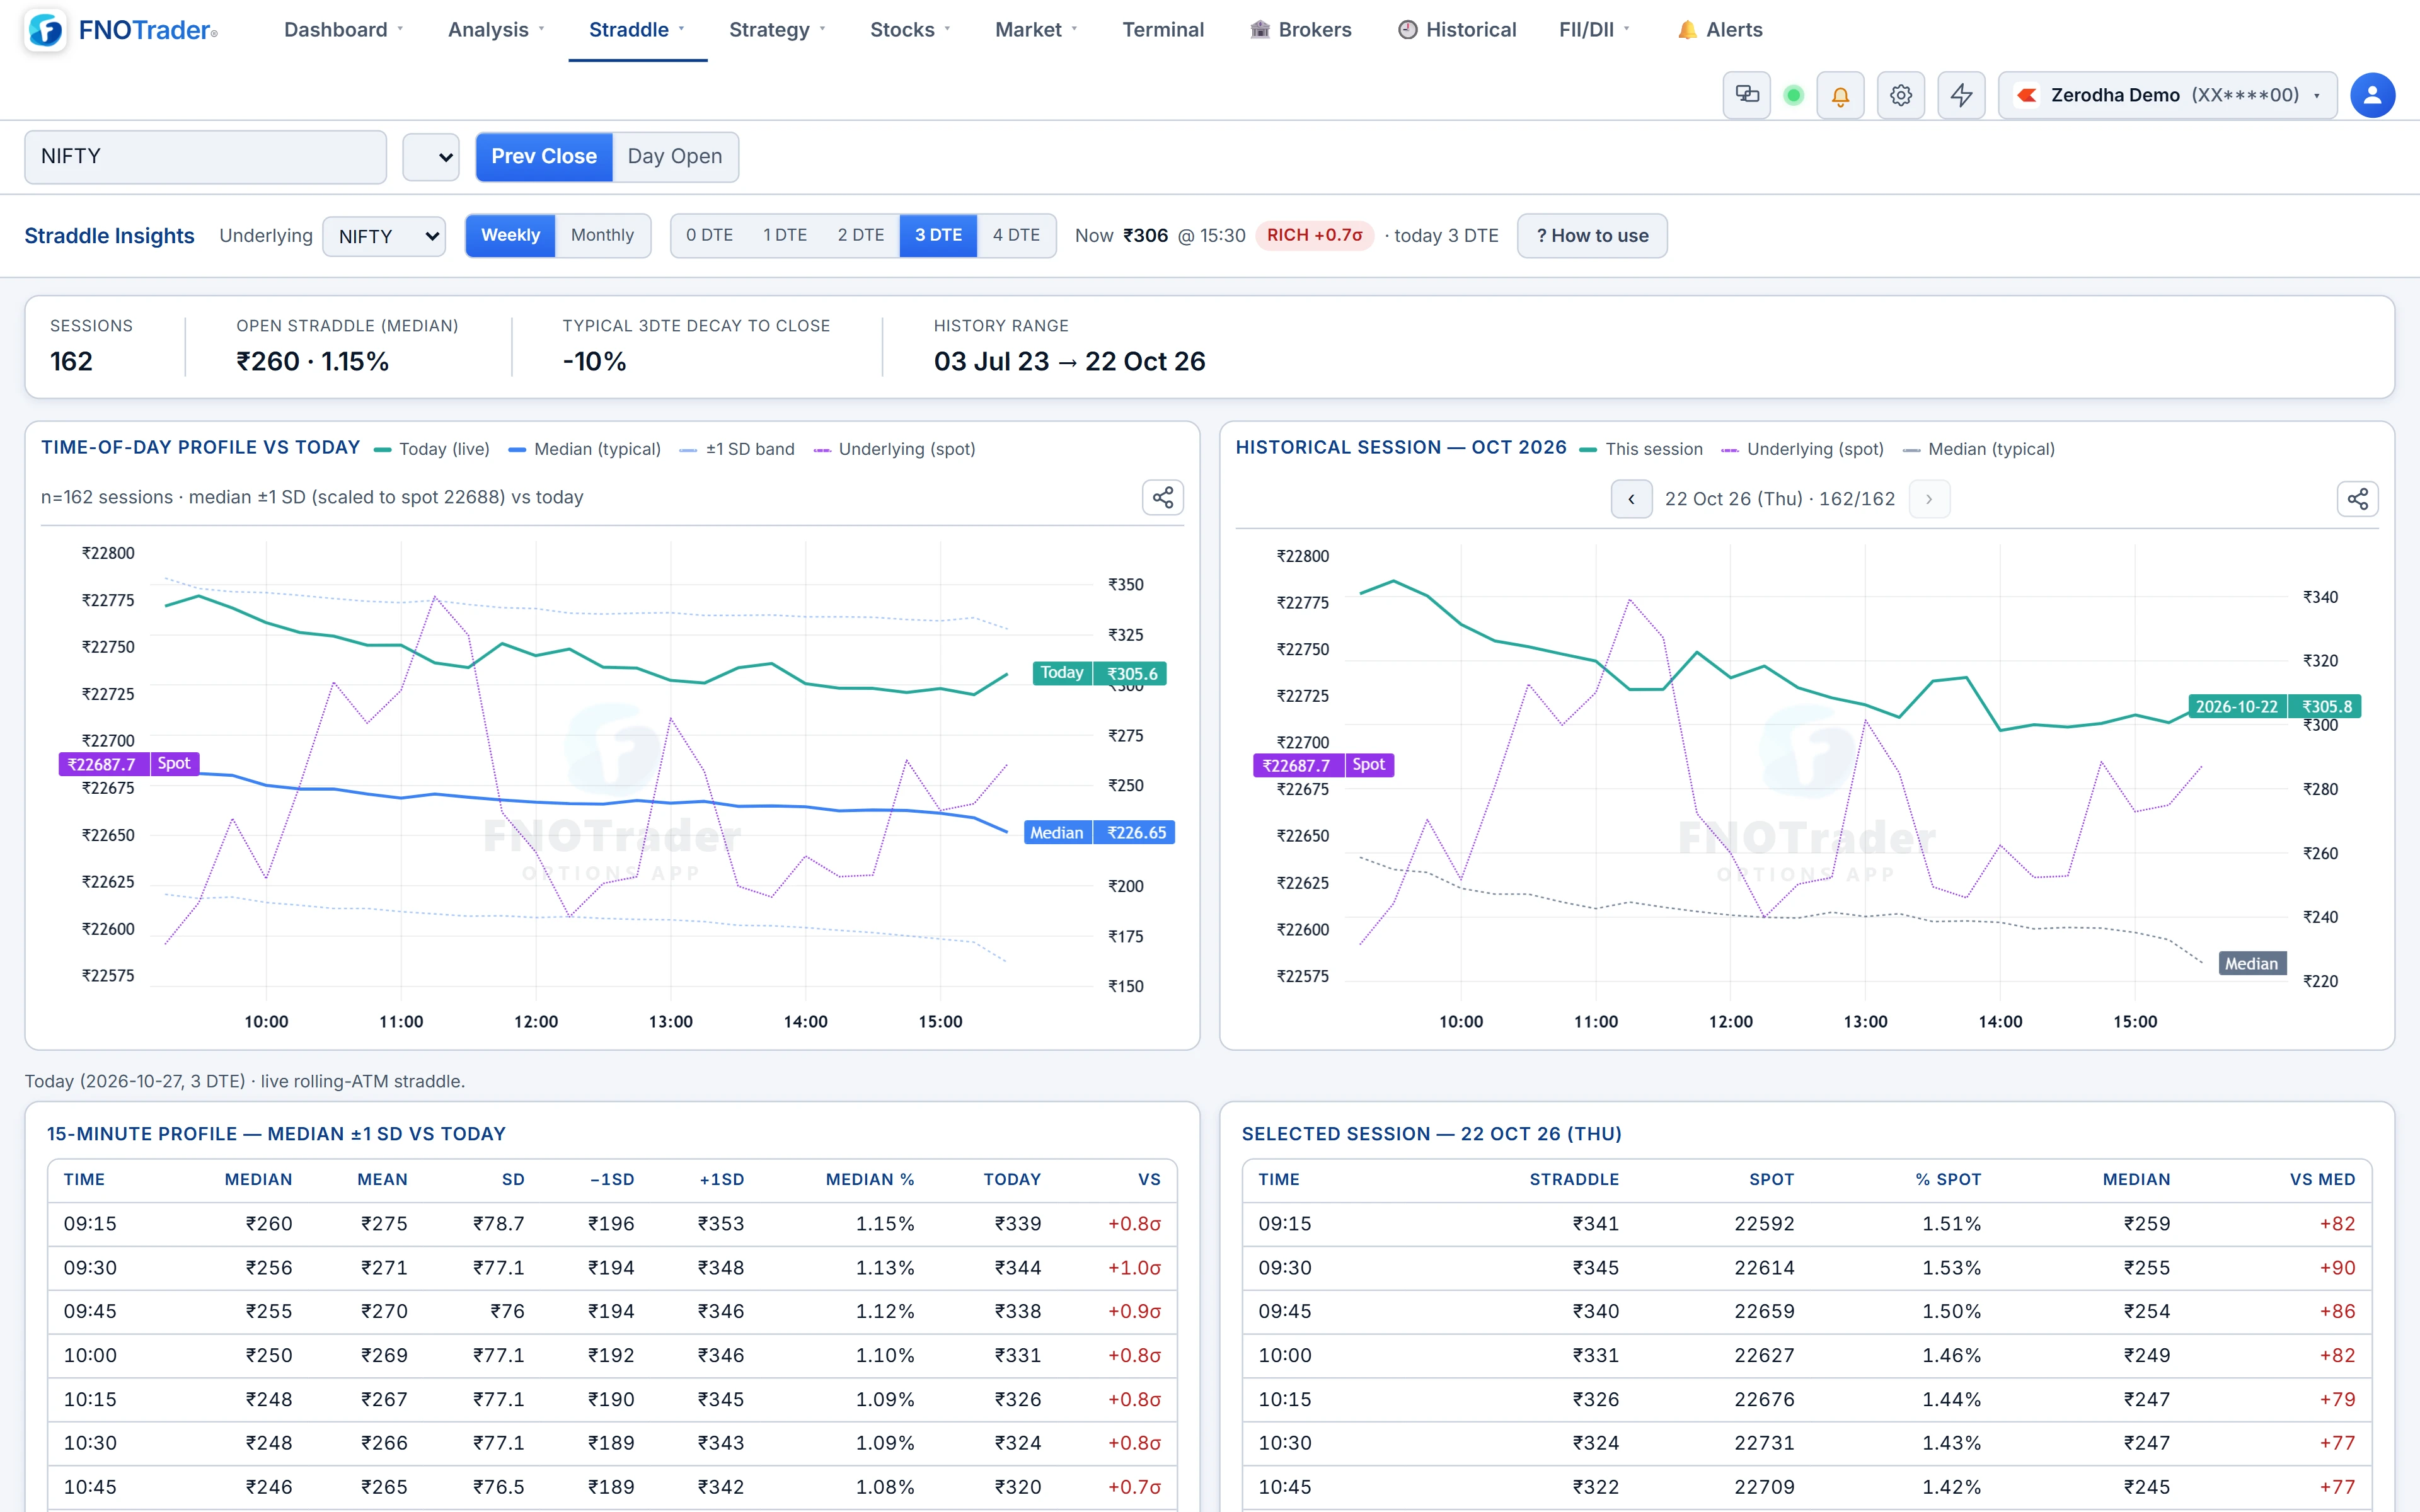
- Time-of-Day Profile vs Today. The median straddle through the session (blue), a ±1 standard-deviation band, today's live rolling-ATM straddle (teal) and the underlying.
- Summary tiles. Number of sessions in the profile, the typical opening straddle in rupees and as % of spot, and the typical decay from open to close at this DTE.
- Historical Session. Step back through past sessions one at a time and see each against the median.
- Tables. Mean, median, SD and the ±1 SD levels per 15-minute bucket, today's value beside them, and how many standard deviations it sits from the mean.
Historical figures are stored as % of spot and converted to rupees at today's spot, so the band is drawn in today's money.
How the rich / cheap verdict is calculated
At the latest available 15-minute mark the page takes today's straddle as a percentage of spot, subtracts the historical mean for that mark, and divides by the historical standard deviation. That is a z-score.
| z-score | Verdict |
|---|---|
| +0.5 or higher | RICH |
| −0.5 or lower | CHEAP |
| Between | FAIR |
The verdict is only given when the DTE tab matches today's actual days to expiry. View the 3 DTE profile on an expiry day and the page tells you to switch tabs rather than grade a 0 DTE straddle against 3 DTE history.
A worked example
Hypothetical. NIFTY at 24,000, 1 DTE, 11:00 IST. The 11:00 bucket of the 1 DTE weekly profile has a mean of 0.62% of spot and an SD of 0.10%.
- Mean in rupees: 0.62% × 24,000 = ₹148.80. The +1 SD level is 0.72% = ₹172.80.
- Today's ATM straddle is ₹170, which is 170 / 24,000 = 0.708% of spot.
- z = (0.708 − 0.62) / 0.10 = +0.88. Verdict: RICH.
The same ₹170 at 2 DTE, where the bucket might average 0.80%, would read CHEAP. The rupee number did not change; the comparison did.
What rich and cheap do not mean
- Rich is often rich for a reason. A policy announcement, results season or a large overnight move can justify a premium well above its usual path. Check the calendar before treating it as mispriced.
- The band is history, not a forecast. Roughly two in three past sessions sat inside ±1 SD; today does not have to.
- The profile covers NIFTY and SENSEX only, and DTE from 0 to 4.
- For what changes on the last day itself, see expiry day options.
Where to find it
- Open Options Analytics › Straddle › Straddle Insights.
- Pick the Underlying, then Weekly or Monthly.
- Choose the DTE tab; it auto-selects today's on load.
- Read the verdict pill, then use the Historical Session arrows to see past days.
To see the same straddle as multi-day candles, open the Rolling ATM Straddle.
Common questions
How do I know if the NIFTY straddle is expensive today?
Compare it with past sessions at the same time of day and the same days to expiry, as a percentage of spot. Straddle Insights does this and shows a rich, cheap or fair verdict.
What does RICH mean on Straddle Insights?
Today's ATM straddle, as a share of spot, is at least half a standard deviation above the historical mean for that 15-minute mark and DTE.
Why measure the straddle as a percentage of spot?
Because the same rupee premium means different things at different index levels. A percentage stays comparable as the index moves.
Why is there no verdict on some tabs?
The verdict is shown only when the DTE tab matches today's days to expiry, so a straddle is never graded against history from a different DTE.
More on Options App
More in Options App · App: Options Analytics · Definitions: glossary · All: every article