Why chart the combination
A multi-leg position does not exist as a single instrument on any exchange, so it has no chart — unless you build one.
Netting the legs gives a price series for the position itself. Its open, high, low and close tell you how far the structure travelled in each bar, which a payoff diagram cannot: a payoff diagram shows where you end up at expiry, not the path. Watching a structure behave for a few sessions before trading it teaches more than any single diagram.
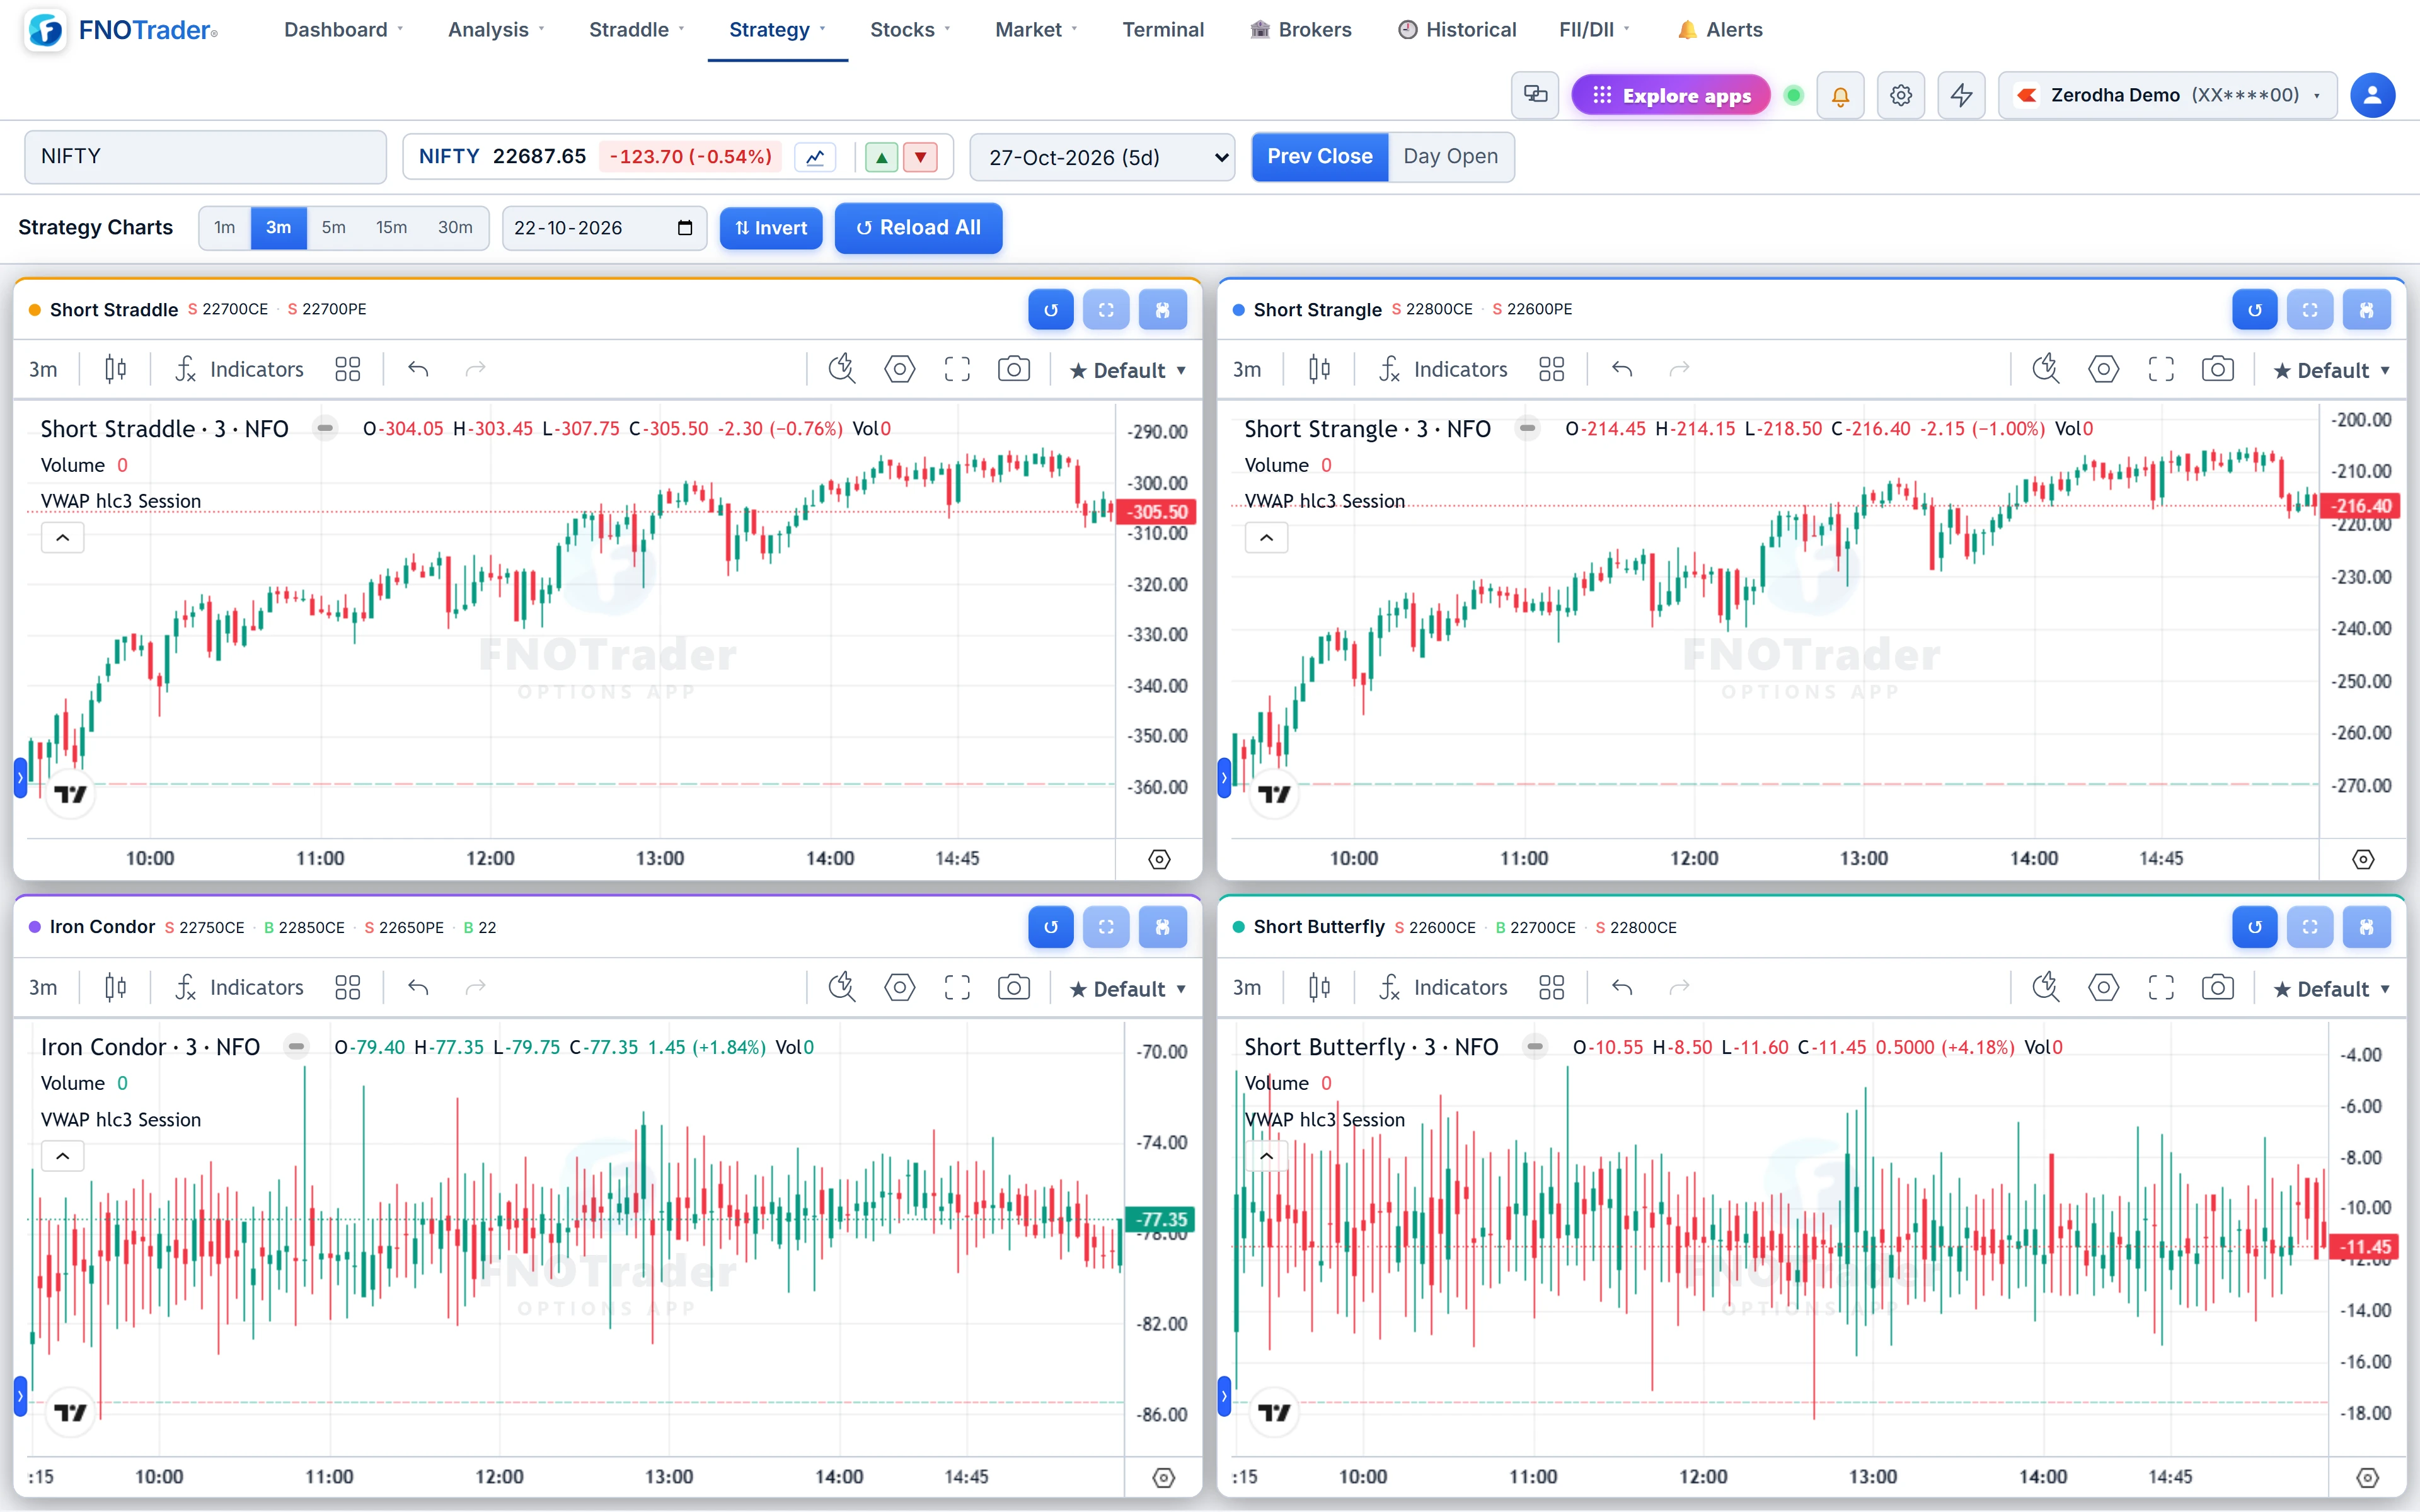
Strategy Chart
- Four panels in a 2 × 2 grid, each an independent structure.
- Edit legs inline — buy or sell, CE or PE, strike, quantity — or quick-fill a preset: short and long straddle and strangle, iron condor, butterflies, bull and bear spreads, ratio spreads.
- Each leg is signed by buy or sell, so the series is the net premium of the structure. The OHLC readout can therefore go negative for a net credit.
- Timeframes 1m, 3m, 5m, 15m, 30m. Candles or line per panel, with optional EMA 9 and EMA 21.
- A date picker loads a previous session.
- Invert flips the price scale, so a short structure reads with up as good.
The candles come from tick data for the combination, not from adding each leg's candles, so the highs and lows are ones the structure actually reached.
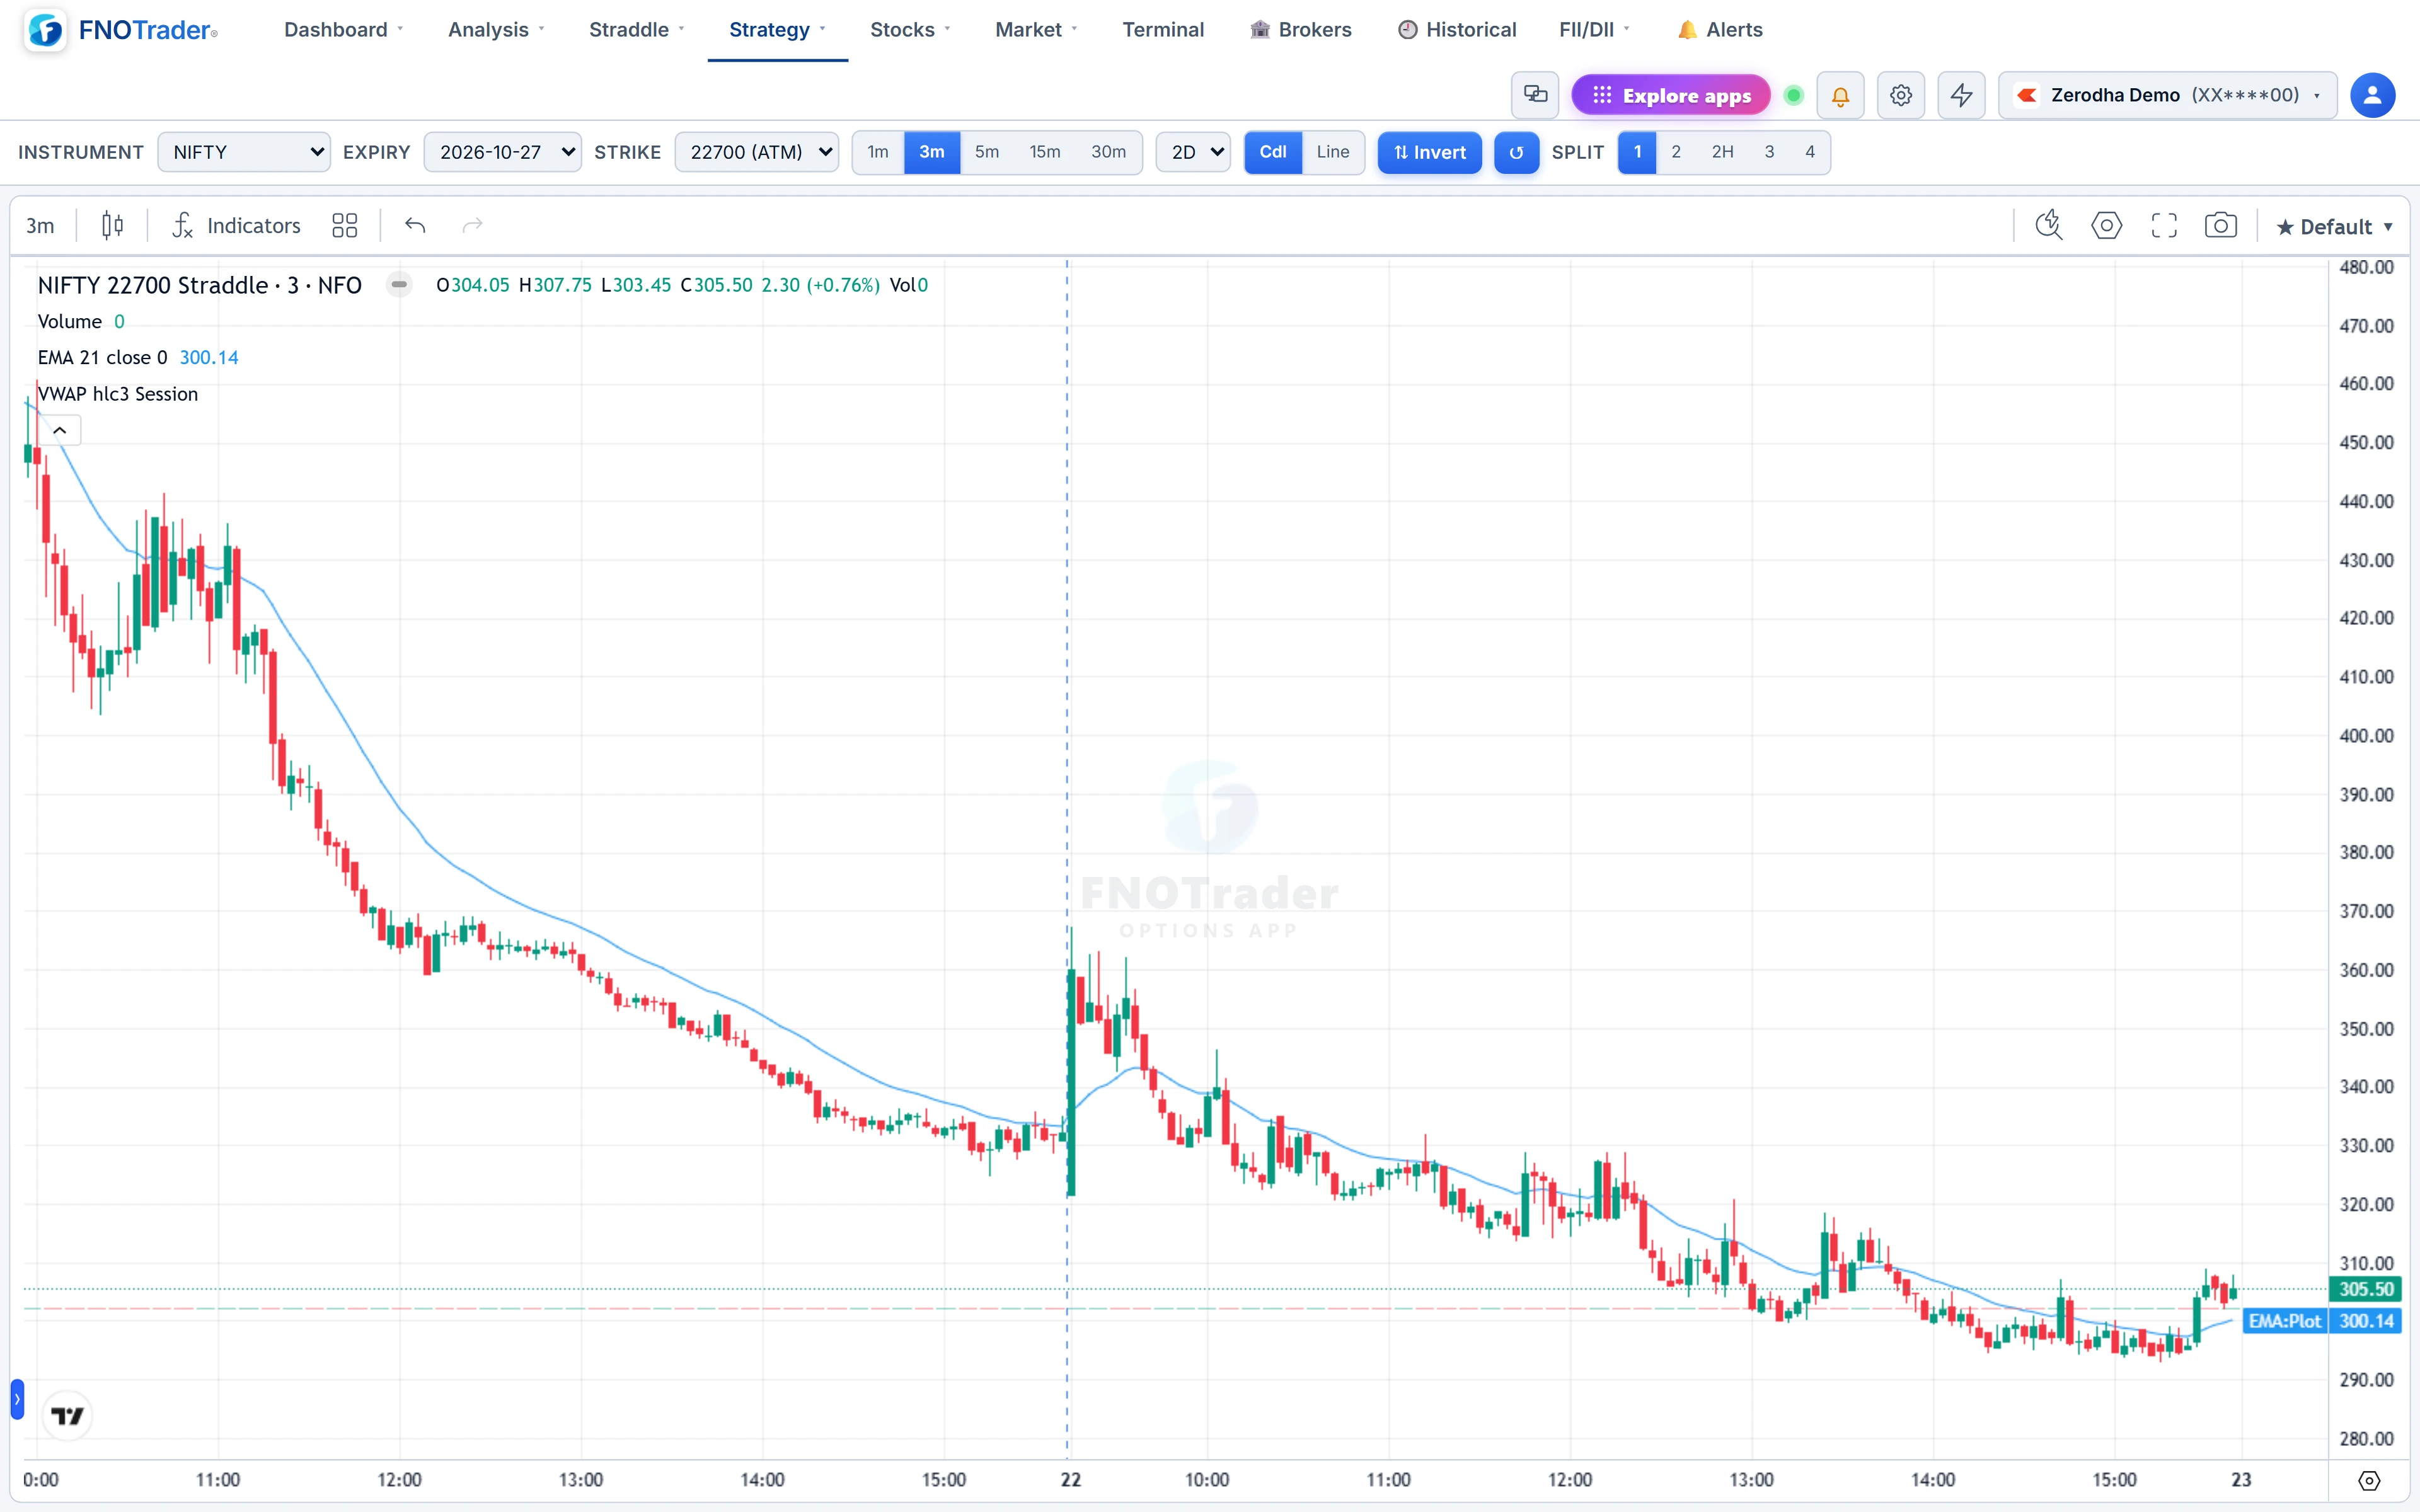
Straddle Charts OHLC and Strangle Charts OHLC
These pages are for a position you hold at fixed strikes. Unlike the Rolling ATM Straddle, the strike never moves.
| Control | Options |
|---|---|
| Instrument, Expiry | Chosen on the page, independent of the top bar. |
| Strike (straddle) or CE / PE Strike (strangle) | The pair you hold or are pricing. |
| Interval | 1m, 3m, 5m, 15m, 30m. |
| Period | 1, 2 (default) or 5 trading days. |
| Chart type, Invert | Candle or line; flip the scale for shorts. |
| Split | 1, 2 side by side, 2 stacked, 3, or a 2 × 2 grid. Click a chart to make it the one the controls edit. |
Weekends and holidays inside the period are removed, so multi-day candles run continuously.
A worked example
Hypothetical iron condor on NIFTY: sell 24,200 CE at ₹60 and 23,800 PE at ₹58, buy 24,400 CE at ₹22 and 23,600 PE at ₹24.
- Net premium: (60 + 58) − (22 + 24) = ₹72 credit per unit.
- An hour later the shorts are ₹52 and ₹50 and the wings ₹18 and ₹19: (52 + 50) − (18 + 19) = ₹65. The structure is ₹7 cheaper, a ₹7 per unit gain for the seller.
- On the Strategy Chart, with sells counted against buys, that shows as the net moving toward zero. Invert flips the picture so the gain reads as up.
Multiply by lot size and lots for rupees; the chart itself is per unit.
Limits and common mistakes
- Choose coarser bars for multi-leg structures. They move slowly by design, and 1-minute candles of a net credit are mostly noise.
- The charts show premium, not margin or costs.
- The OHLC pages keep the strike fixed. If spot has moved far away, the chart is mostly the direction of one leg; that is accurate for your position but says little about volatility.
Where to find it
- Options Analytics › Strategy menu.
- Strategy Chart: click a panel's ✎ to edit legs or pick a preset, then Load.
- Straddle Charts OHLC or Strangle Charts OHLC: pick instrument, expiry and strikes, then period and interval.
- Use Invert if you are short.
When a structure looks right, take it into the Strategy Builder for payoff, POP and margin.
Common questions
How do I chart an iron condor as one line?
Enter the four legs in a Strategy Chart panel. Each leg is signed by buy or sell and the panel plots the net premium of the structure as candles or a line.
What does Invert do on the strategy chart?
It flips the price scale vertically, so a short position reads with profit as up.
What is the difference between Straddle Charts OHLC and Rolling ATM Straddle?
Straddle Charts OHLC stays on the strike you pick, so it charts your position. Rolling ATM re-centres on the current ATM strike, so it charts the volatility regime.
Can I see a strategy on a past day?
Yes. The Strategy Chart has a date picker, and the OHLC pages load 1, 2 or 5 trading days.
More on Options App
More in Options App · App: Options Analytics · Definitions: glossary · All: every article