The question it answers
Is the volatility priced into this stock's options unusual — for this stock, right now?
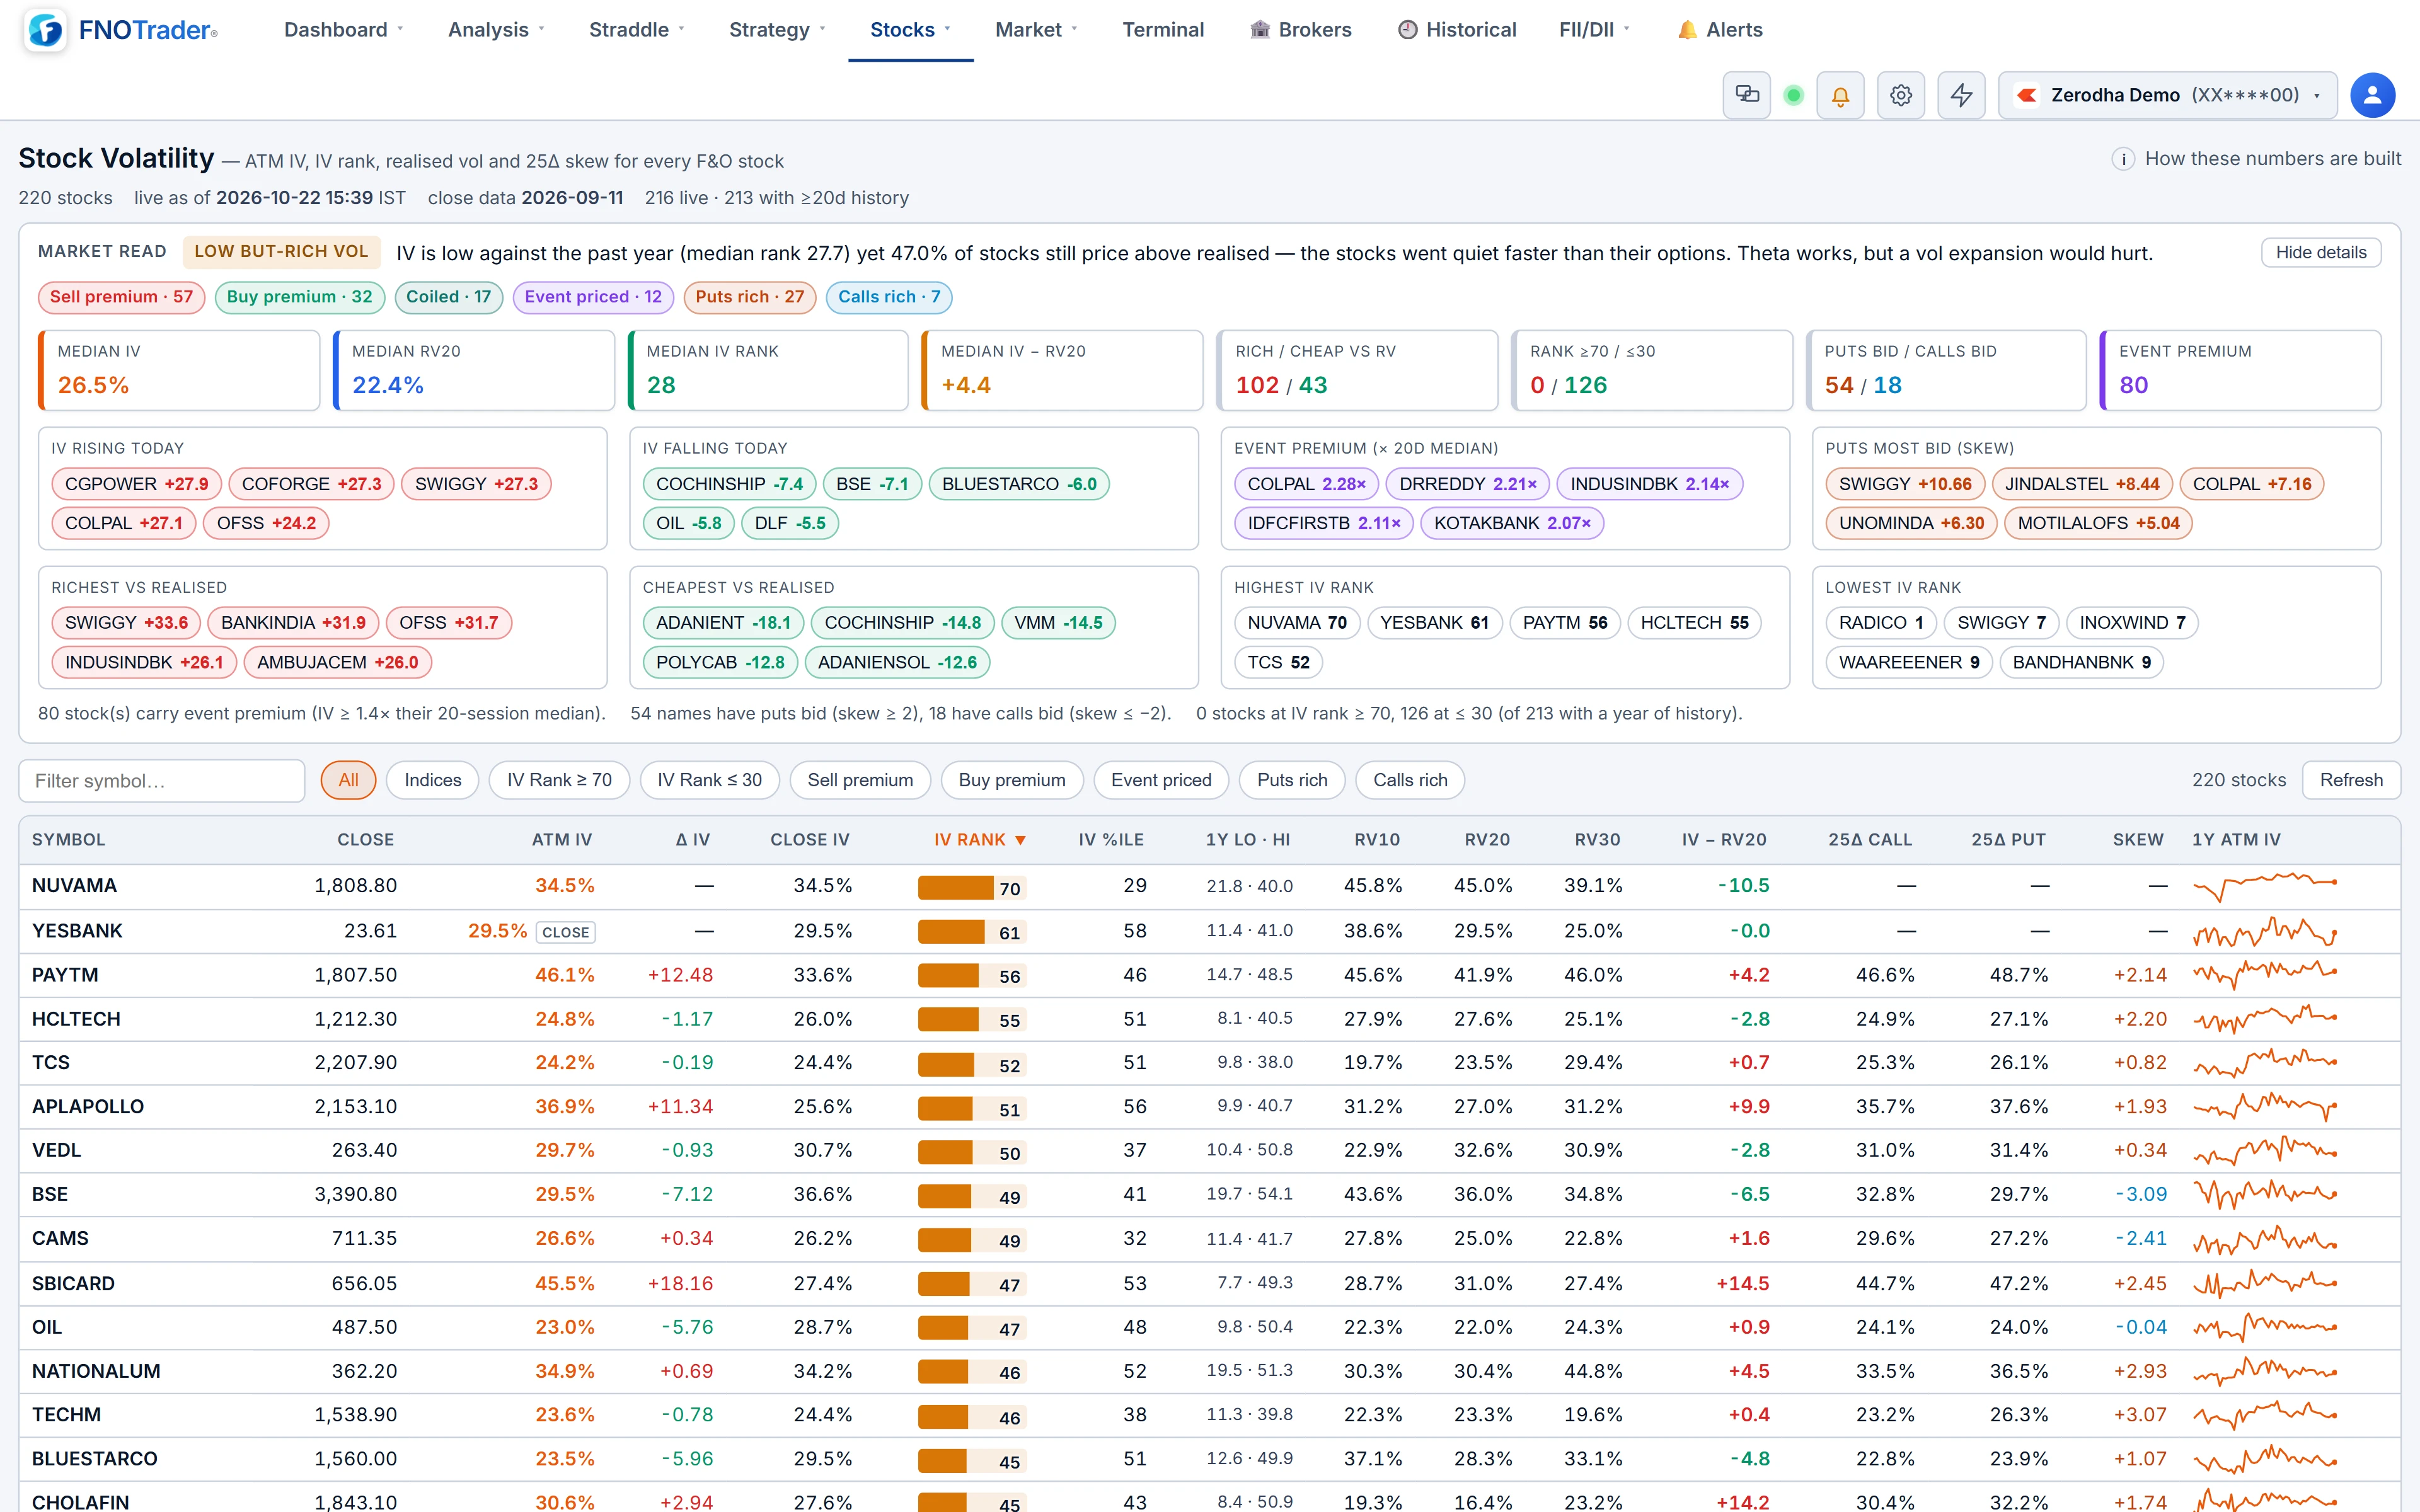
Implied volatility is a price. Like any price it only means something in context: against its own range over the past year, and against how much the stock has really been moving. The Stock Volatility page lines up those comparisons in one table, sorted by IV rank by default, and lets you click any row for a one-year chart of implied against realised volatility.
If you want the deeper, surface-level view of a single name, Vol Lab covers it — see Vol Lab's stock overview. This page is the fast, market-wide scan inside the Options app.
How each number is built
| Column | Definition |
|---|---|
| ATM IV (live) | Solved with Black-76 from the call and put at the strike nearest the front-month future, from the latest minute |
| Close IV | Same definition, median of 15:10–15:25 IST on the last session |
| Δ IV | Live ATM IV minus the previous close, in vol points |
| IV Rank | (IV − 1-year low) ÷ (1-year high − 1-year low) × 100 |
| IV %ile | Share of the last 252 sessions with a lower ATM IV |
| RV10 / RV20 / RV30 | Annualised standard deviation of daily log returns over 10, 20 and 30 sessions |
| IV − RV20 | The volatility risk premium in vol points; positive means options price more movement than the stock has delivered |
| 25Δ Call / Put | IV interpolated at call delta 0.25 and put delta −0.25 from the live chain |
| Skew | 25Δ put IV minus 25Δ call IV; positive means downside protection is bid |
The front month rolls to the next one inside four days of expiry, so the number does not collapse into expiry-week noise. Indices use their nearest expiry with at least four days left. Rank and percentile need at least 20 sessions of history and show n/a until then. If no near-the-money option has traded today, the live column falls back to the close IV and says so.
IV rank vs IV percentile
They sound alike and disagree often. Rank only looks at the extremes; one spike in the past year drags the high up and makes every later reading look low. Percentile counts days, so it is harder to distort with a single event.
Hypothetical stock: over the past year ATM IV ranged from 18% to 48%, and today it is 33%.
- IV rank = (33 − 18) ÷ (48 − 18) = 15 ÷ 30 = 50.
- Suppose 200 of the last 252 sessions closed below 33%. IV percentile = 200 ÷ 252 = 79.
Rank says "middle of the range"; percentile says "higher than four days in five". The 48% spike came from one results day. Percentile is telling the truer story here, and the sparkline next to the row shows you why.
Implied vs realised, and skew
Continue the example: RV20 is 25%. IV − RV20 = 33 − 25 = +8 vol points. Options are pricing noticeably more movement than the stock has given over the last month. That gap is normal — option sellers demand a premium — but its size relative to the stock's own history is what matters, which is what the IV vs RV chart on row click shows.
Now skew: 25Δ put IV 36%, 25Δ call IV 30% → skew +6. Downside protection is costing more than upside participation. A negative skew — calls bid over puts — is less common in single stocks and usually worth a second look at the news.
The summary strip above the table gives the market-wide picture: median IV rank, median RV20, how many names sit at rank ≥ 70 or ≤ 30, and how many have puts versus calls bid.
Common mistakes
- Reading high IV rank as "sell". IV is high for a reason more often than not: results, a court ruling, an index event. Check the events calendar first.
- Trusting rank on a new listing. With a short history the one-year range is narrow, and rank swings wildly.
- Using RV10 alone. Ten sessions is noisy. RV20 and RV30 are steadier baselines for the IV gap.
- Treating skew as live after the close. Skew is a live-only reading; outside market hours it is blank.
Where to find it
- Open Options Analytics → Stocks → Stock Volatility.
- Use the chips — All, Indices, IV Rank ≥ 70, IV Rank ≤ 30 — or type a symbol.
- Sort any column; click a row for the one-year IV vs RV chart.
The table refreshes every minute while open. To turn a volatility view into a sized expected move, pair it with the Stocks ATM Straddle page.
Common questions
What is the difference between IV rank and IV percentile?
IV rank places today's IV between the one-year low (0) and high (100). IV percentile is the share of the last 252 sessions with a lower IV. One spike distorts rank more than percentile.
How is ATM IV calculated on this page?
With the Black-76 model from the call and put at the strike nearest the front-month future, rolling to the next month inside four days of expiry.
What does a positive IV minus RV20 mean?
Options are pricing more movement than the stock has delivered over the last 20 sessions. It is the volatility risk premium, measured in vol points.
What does 25-delta skew measure?
The IV of the 25-delta put minus the IV of the 25-delta call. Positive values mean downside protection costs more than upside calls.
More on Options App
More in Options App · App: Options Analytics · Definitions: glossary · All: every article