What a VCP is, and why it is hard to scan
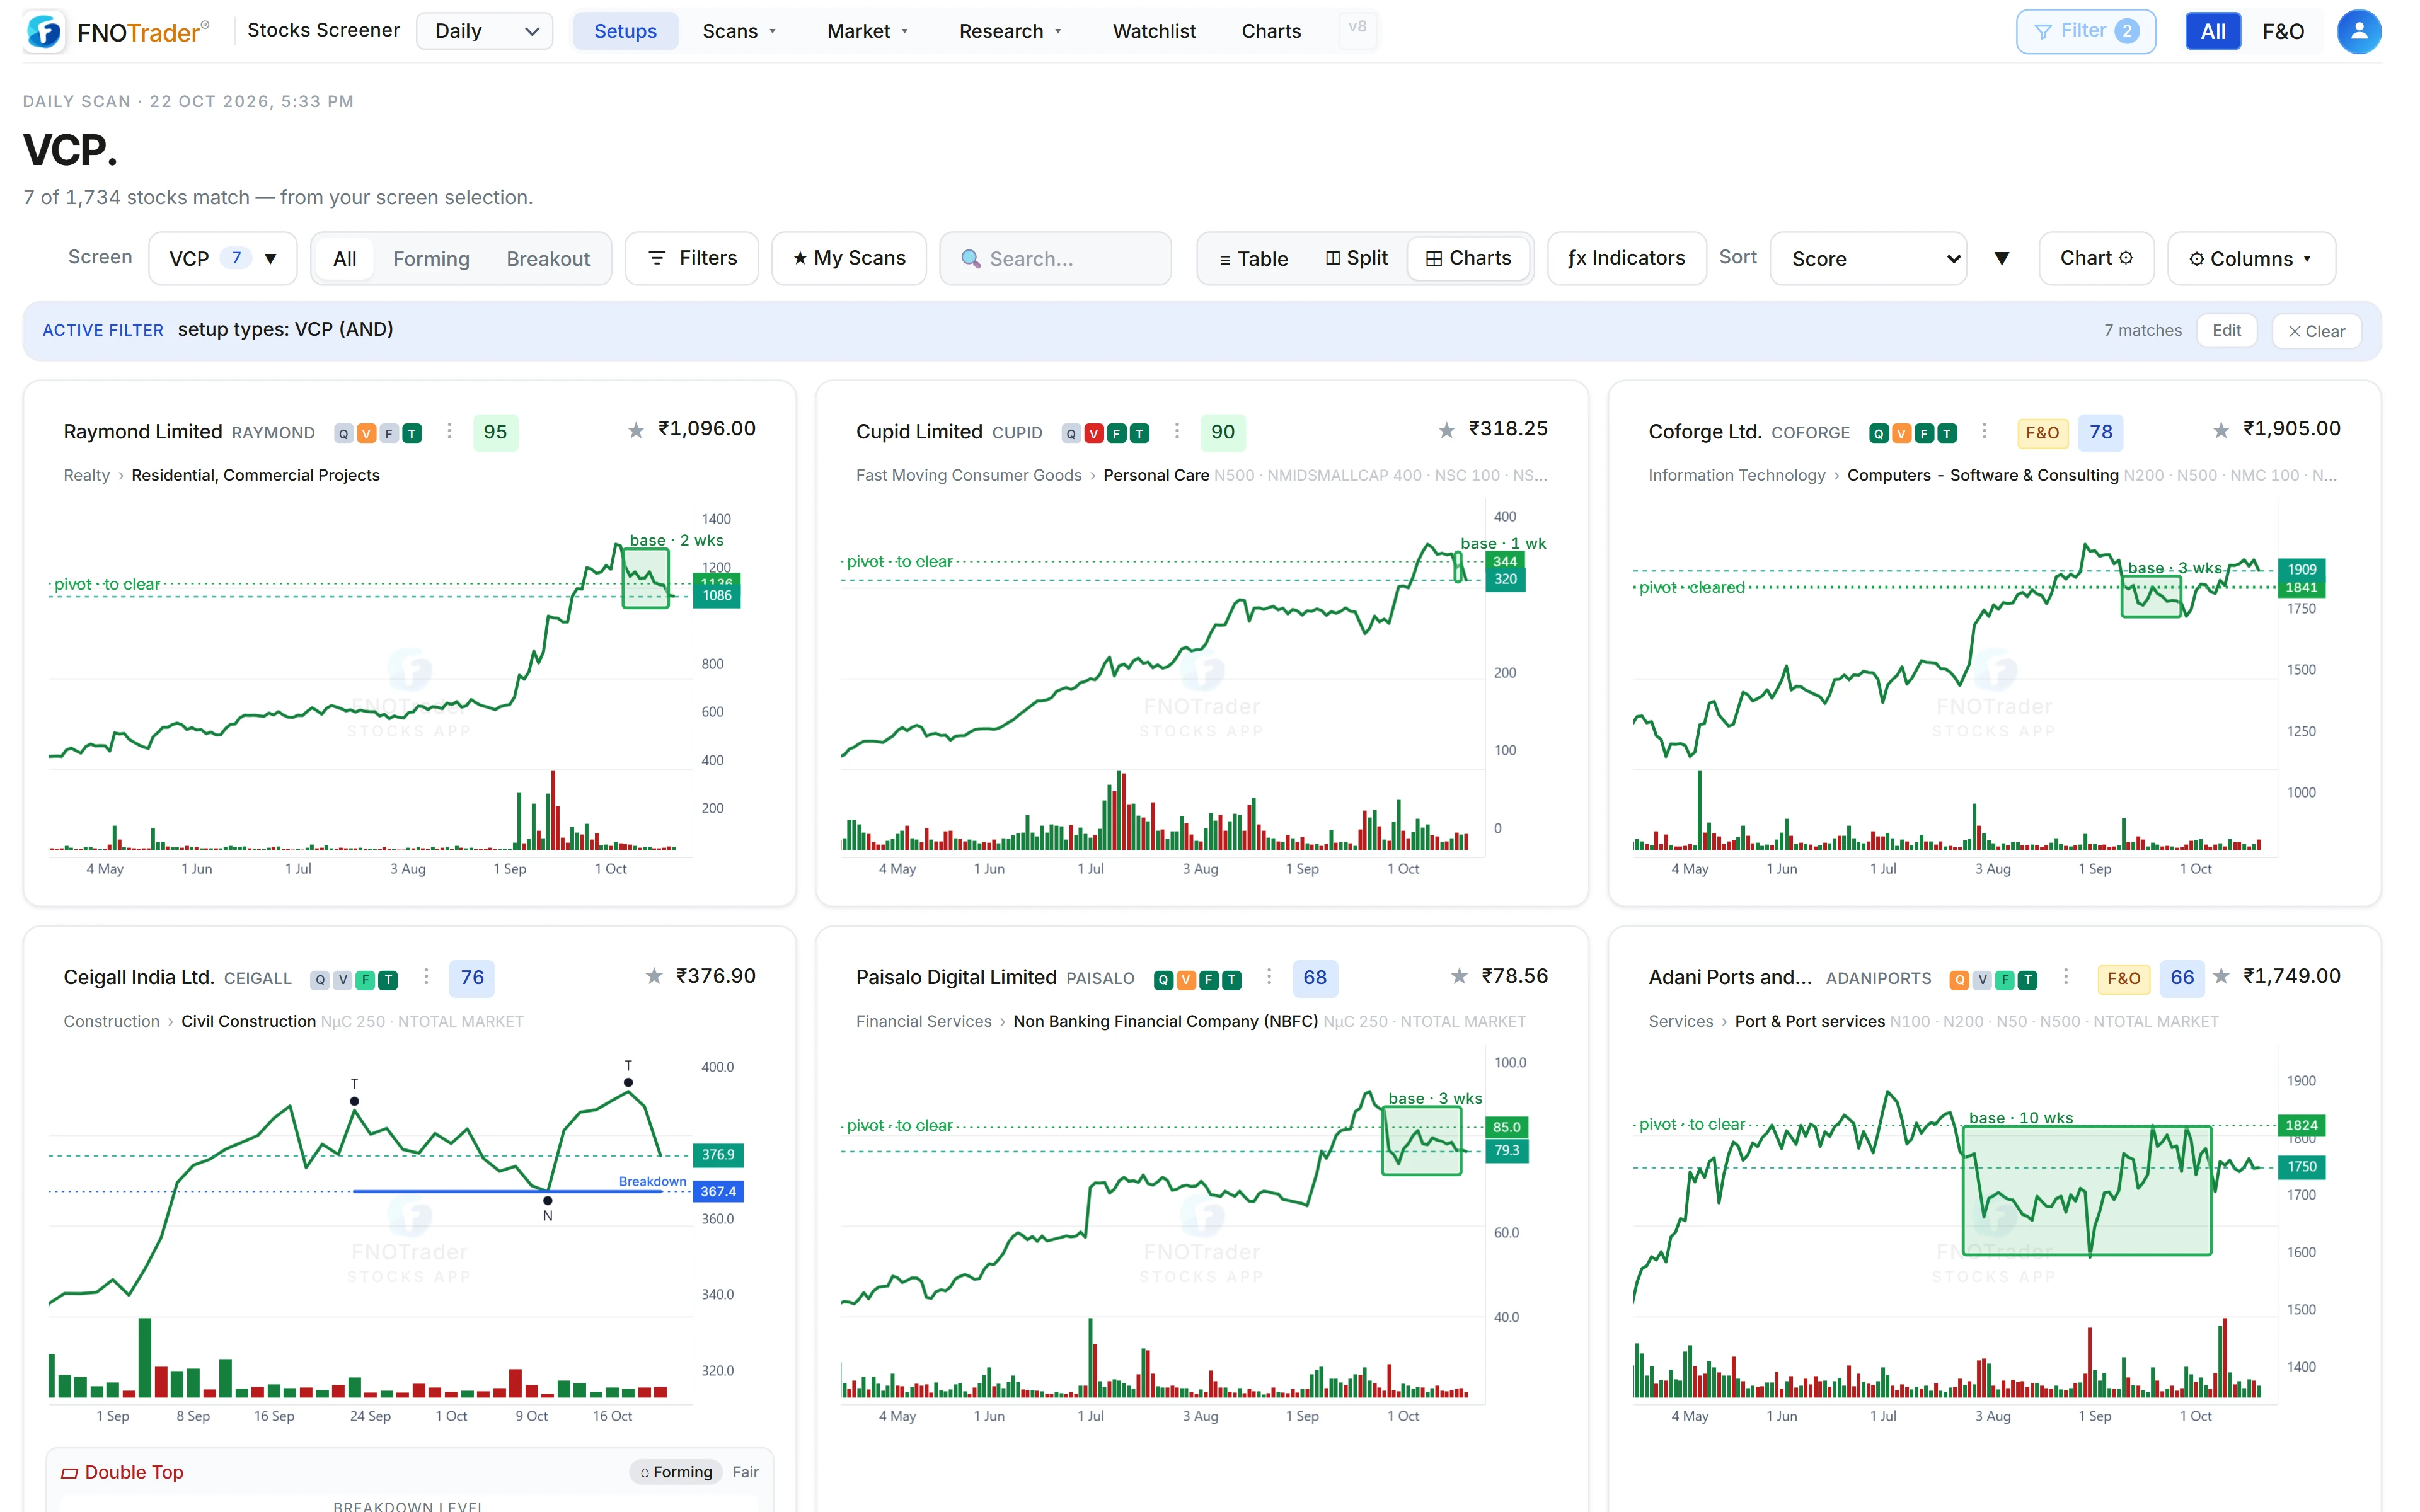
A volatility contraction pattern is a stock in an uptrend that pauses, with each pull-back shallower and quieter than the one before, until the range is tight enough that a small amount of buying can move it through the ceiling.
The difficulty is that “shallower”, “quieter” and “uptrend” are all judgement calls. A scanner has to turn each into a number, and the numbers decide whether you get five candidates or fifty. Below are the numbers the Stocks app actually uses.
Gate 1: the trend template on full history
Before looking for contractions at all, the detector checks that the stock is a leader. It uses the stock's full stored daily history — at least 200 sessions, or it does not fire — because a six-month window cannot judge a 200-day average.
- Price above the 50-day SMA, the 50 above the 150, the 150 above the 200.
- Both the 150-day and 200-day SMAs higher than they were 22 sessions ago.
- Price at least 25% above its 52-week low.
- Price within 25% of its 52-week high.
A stock 40% off its high and below every average is not pausing; it is falling. This gate is what keeps it out.
Gate 2: the contractions
The detector then looks back up to 120 bars for the highest high — the peak the base starts from — and requires at least 8 bars after it. The total fall from that peak to the lowest low since must be between 8% and 50%.
It then walks the swings inside the base and needs:
| Rule | Threshold |
|---|---|
| Number of pull-backs | 2 to 5 |
| Each pull-back | Strictly shallower than the one before |
| First pull-back | At least 8% deep |
| Last pull-back | No more than 10% deep |
| Volume | Average volume of the last contraction below the first |
| Pivot | The high of the last contraction; price no more than 8% under it |
Base volume below the stock's one-year average is not a gate; it raises the confidence score. So do more clean contractions, a tighter final contraction, price close to the pivot and price close to the 52-week high.
A worked example
A hypothetical stock peaks at ₹700, then pulls back 18%, recovers, pulls back 9%, recovers, and pulls back 4%. The high of that last 4% swing is ₹640 and the stock now trades at ₹622.
- Depths 18% → 9% → 4%: each shallower, the first at least 8%, the last at most 10%. Passes.
- Distance to pivot: (640 − 622) / 640 = 2.8%, inside 8%. Passes.
- If volume in the 4% swing averages less than in the 18% swing, it passes the dry-up gate.
It now shows as a VCP in the Forming stage. If it later closes at ₹645 on a day whose volume is at least 1.4× the 20-day average, the detector marks it as broken out, and from then on its stage tracks price against ₹640. The stages are explained in the Setups scanner post.
The 8-point trend template score
Separately from the VCP detector, every stock carries a trend template score from
0 to 8, which you can filter on in Custom
Query (Minervini >= 6) and which Momentum 100 uses as a gate. The
eight checks are: price above the 50, 150 and 200-day SMAs; the 50 above the 150; the
150 above the 200; the 200-day rising over the last 30 sessions; price within 25% of the
52-week high; and price at least 30% above the 52-week low.
The two are close but not identical — the score's 52-week-low test is 30%, the VCP gate's is 25% — so a stock can show as a VCP with a score of 7.
What the detector will and won't catch
- It is deliberately not the strictest version. It allows up to five contractions and a final pull-back up to 10%. A purist screen would return far fewer names. Use the confidence score and the depths column to rank.
- Fresh IPOs never qualify — there is no 200-day history to validate the trend.
- A VCP on the weekly scan is measured on weekly bars and is a much larger base than a daily one.
- Forming is not a signal. Many bases resolve downward. The stage only tells you where price is relative to the pivot.
Where to find it
- Open the Stocks app on Setups.
- Choose VCP in the Screen menu, and Forming or Breakout in the stage switch.
- Or open Scans → Screeners and run the VCP card under Premium Scanners.
- Open a stock to see its contraction depths, pivot and distance from the pivot.
Common questions
How do I find VCP stocks in India?
The FNOTrader Stocks app runs a VCP detector on every scanned NSE stock each evening. Choose VCP in the Setups screen menu, or run the VCP card in the Screener gallery.
What is the pivot in a VCP?
The high of the final, tightest contraction. It is the level price has to close above for the pattern to count as a breakout.
What volume does a VCP breakout need here?
The detector counts a breakout when price is at or above the pivot on a day whose volume is at least 1.4 times the 20-day average.
What is Minervini's trend template?
Eight checks that a stock is in a Stage 2 uptrend: price above the 50, 150 and 200-day averages, those averages stacked in order, a rising 200-day, price near its 52-week high and well above its 52-week low.
Why does a stock show as VCP but fail the trend template?
The VCP gate and the 8-point score use slightly different thresholds, for example 25% versus 30% above the 52-week low, so the two can disagree on a borderline stock.
More on Stocks App
More in Stocks App · App: Stocks Scanner · Definitions: glossary · All: every article