What the page is for
A strangle is an OTM call and an OTM put at different strikes. Its premium is the two prices added together.
If you have sold a strangle, that sum is your position. If you are scouting one, the sum through the session tells you how the pair has behaved — whether it has been bleeding steadily or swinging. The page lets you pick the call strike and the put strike independently, so it charts symmetric strangles and skewed ones equally well.
The trade-off between the two structures is covered in straddle vs strangle; this page is the tool for watching one.
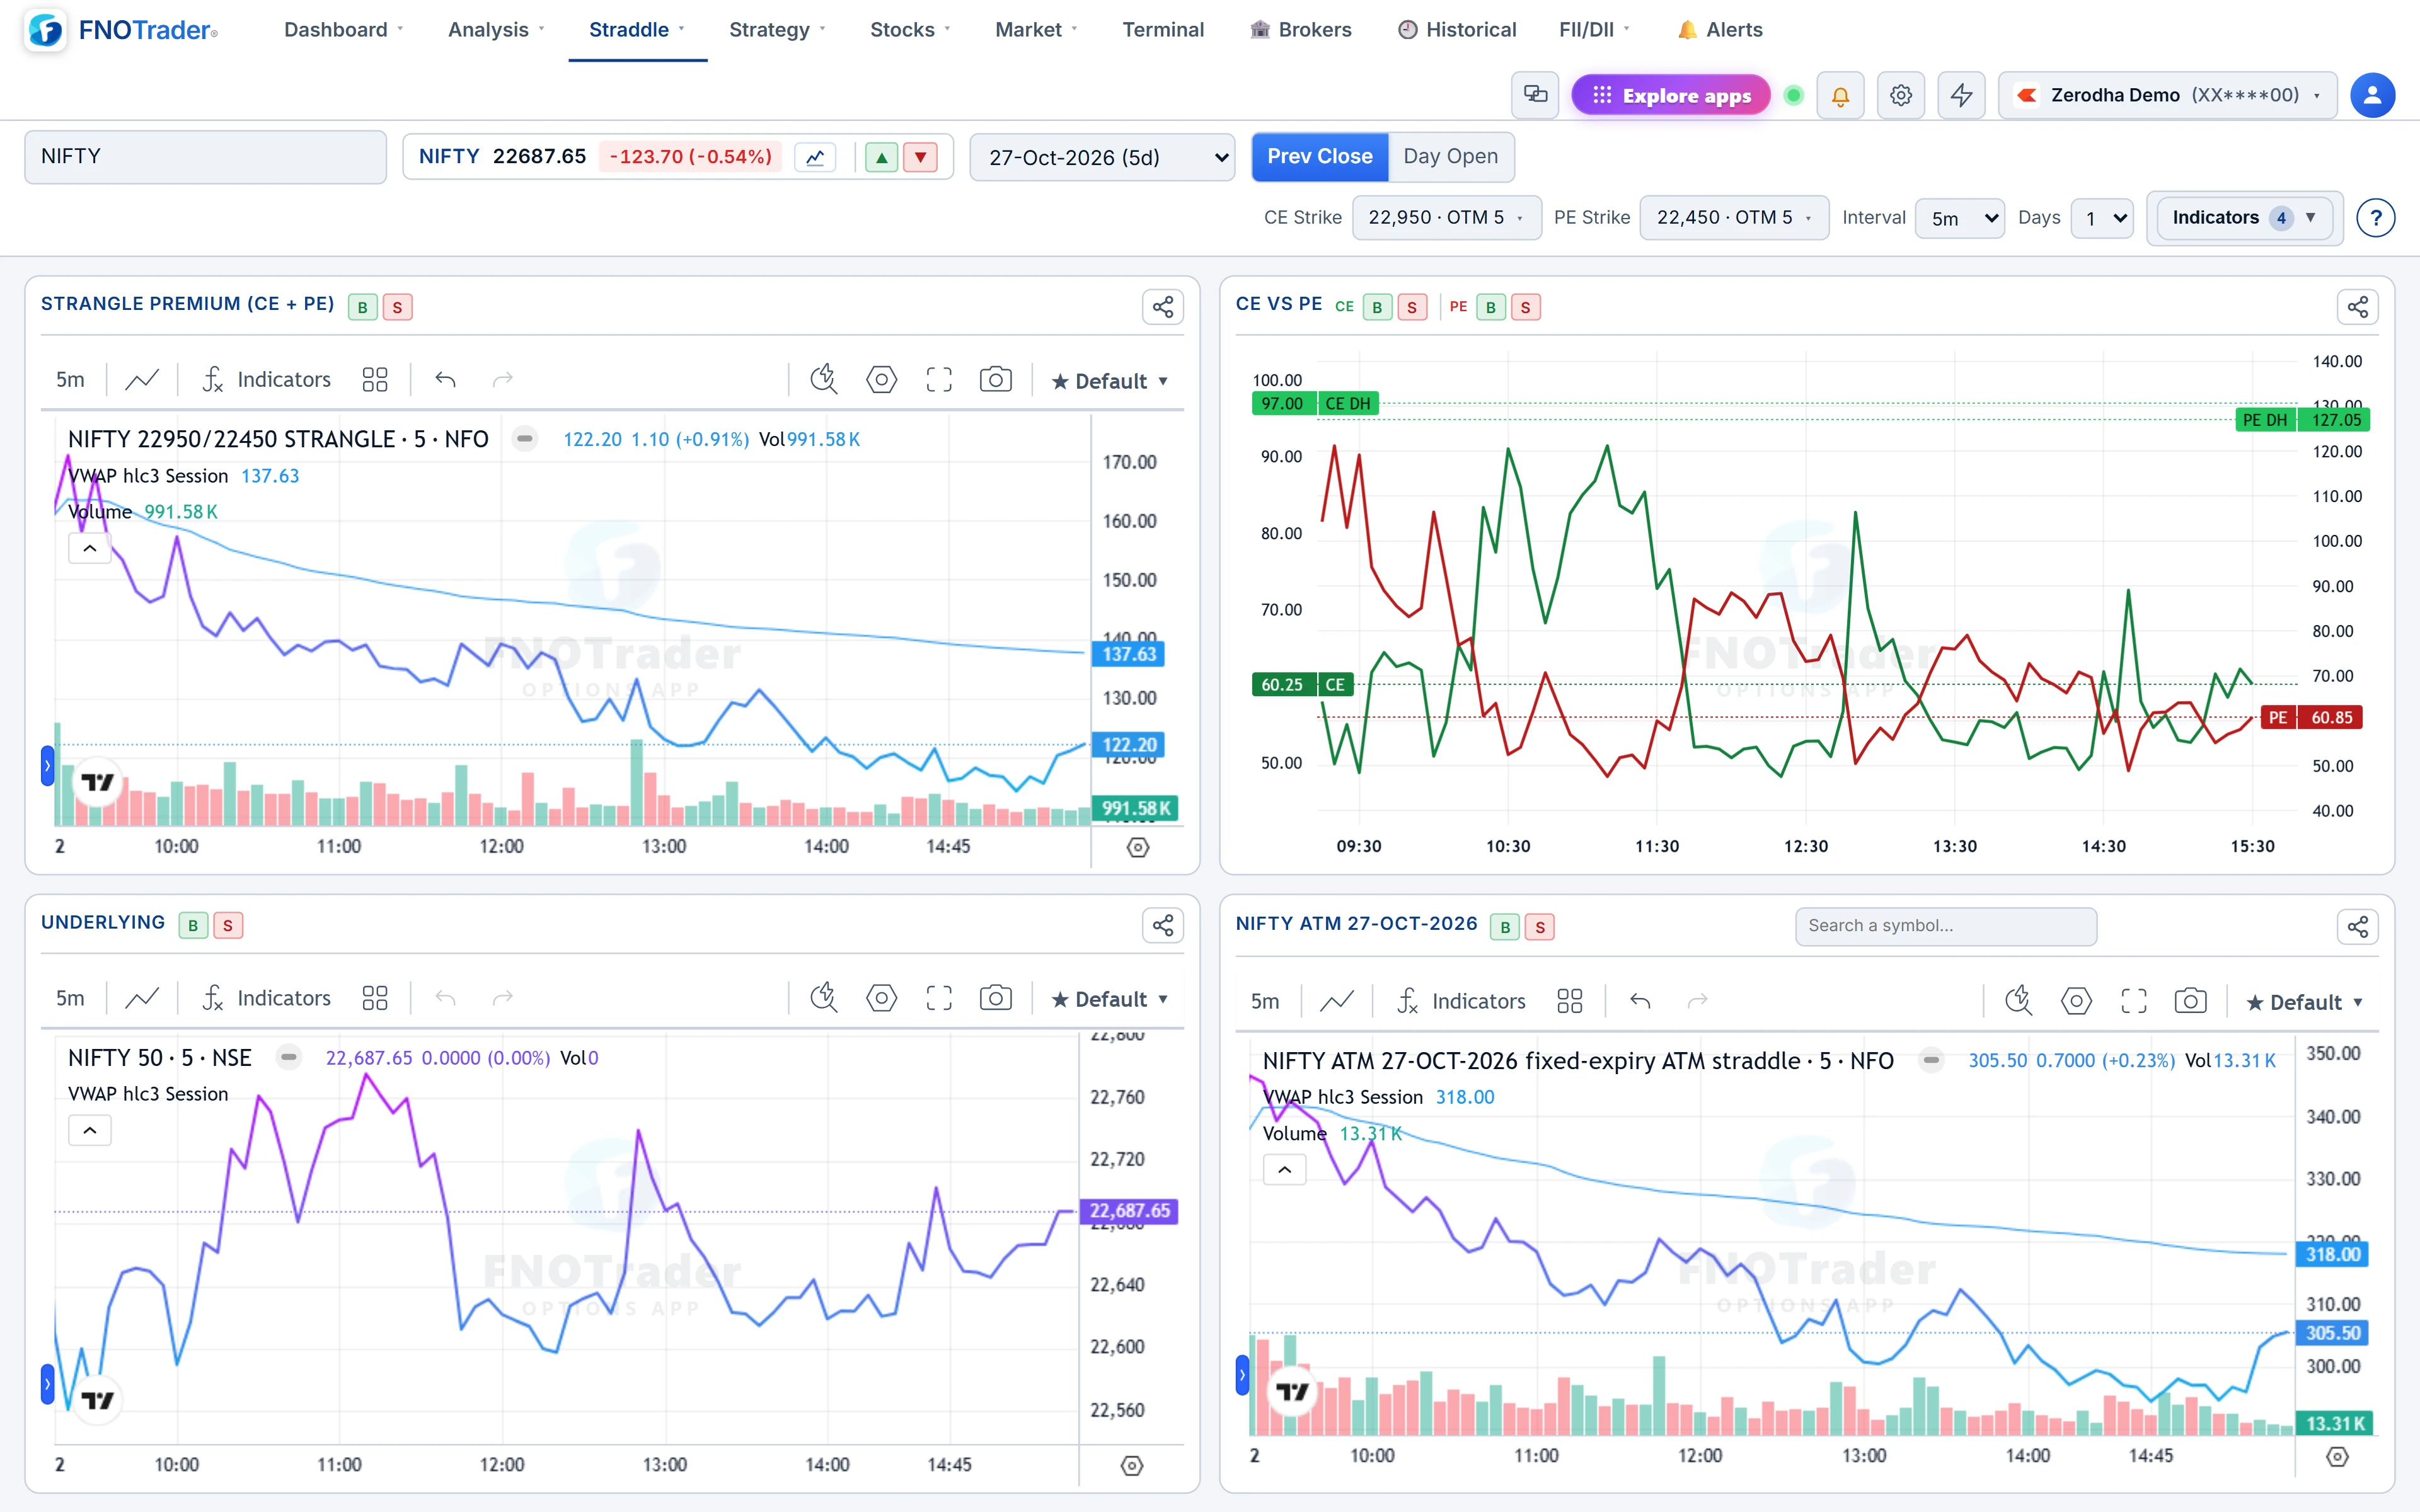
The four panes
| Pane | What it plots |
|---|---|
| Strangle Premium (CE + PE) | The call at your CE strike plus the put at your PE strike. Line, or candles built from tick data. |
| CE vs PE | The two wings on one chart. |
| Underlying | Spot as line, candle, mountain or baseline. |
| ATM Straddle (synthetic, continuous) | The at-the-money straddle, re-centred as spot moves — the benchmark for the volatility regime. |
Interval runs from 1 to 30 minutes and Days from 1 to 5 sessions. The same Indicators menu as the straddle page adds EMA10, EMA20, VWAP and SuperTrend.
Why the ATM straddle sits next to your strangle
A strangle's premium can fall for two different reasons: implied volatility is coming in across the board, or spot is moving toward one wing and away from the other while the far wing collapses. The first is the trade working. The second can be the trade going wrong slowly.
The ATM straddle pane separates them. If the ATM premium is falling at a similar pace, the market's volatility is easing and your strangle is riding it. If the ATM premium is flat while your strangle falls, look at CE vs PE: one wing is almost certainly doing all the work, and the other is getting closer to the money.
A worked example
Hypothetical numbers. NIFTY at 24,000. You sell the 24,300 call at ₹48 and the 23,700 put at ₹52: premium ₹100.
- By 13:00 spot is 24,120. The call is ₹70, the put ₹26. Premium ₹96 — down ₹4, which looks comfortable.
- CE vs PE tells a different story: the call is up 46% and the put down 50%. The pair is roughly flat only because the put is collapsing.
- The ATM straddle pane shows the 24,100 straddle unchanged from the morning. Volatility has not eased; spot has moved. Your remaining put premium, ₹26, is all the cushion left on that side.
Nothing here says what to do. It says the sum alone was hiding a one-sided position.
Limits and common mistakes
- The chart is premium per unit, not rupee P&L; multiply by lot size and lots yourself.
- The two strikes stay fixed. To compare several strangle widths at once, use the Strangle Table.
- For multi-day candles of a strangle you hold, use Strangle Charts OHLC, described in strategy and straddle OHLC charts.
- Margin is not shown here. A short strangle's margin can be large; see SPAN margin explained.
Where to find it
- In Options Analytics, set the symbol and expiry in the top bar.
- Open Straddle › Strangle Charts.
- Pick the CE Strike and PE Strike, then the interval and days.
- Add overlays from Indicators, and switch the premium pane between line and candle.
Common questions
How do I chart a short strangle's combined premium?
Pick the call strike and the put strike on the Strangle Charts page. The top pane plots the two premiums added together through the session.
Can the two strikes be uneven?
Yes. The CE and PE strikes are chosen independently, so a skewed strangle charts the same way as a symmetric one.
Why compare a strangle with the ATM straddle?
The ATM straddle reflects the overall volatility regime. If it is flat while your strangle falls, the drop is coming from one wing collapsing as spot moves, not from volatility easing.
Does the strangle chart show my P&L?
No. It shows premium per unit. Multiply the change by lot size and number of lots for rupee P&L.
More on Options App
More in Options App · App: Options Analytics · Definitions: glossary · All: every article