What does Market Profile (TPO) measure?
Market Profile prints a letter at each price the market touched during each time period, usually 30 minutes, called a TPO (time price opportunity). Stack the letters and you get a sideways histogram of time at price. It brings its own vocabulary: initial balance (the first hour's range), single prints, buying and selling tails, open types and day types. See Market Profile TPO letters, value area and IB and open types and day types.
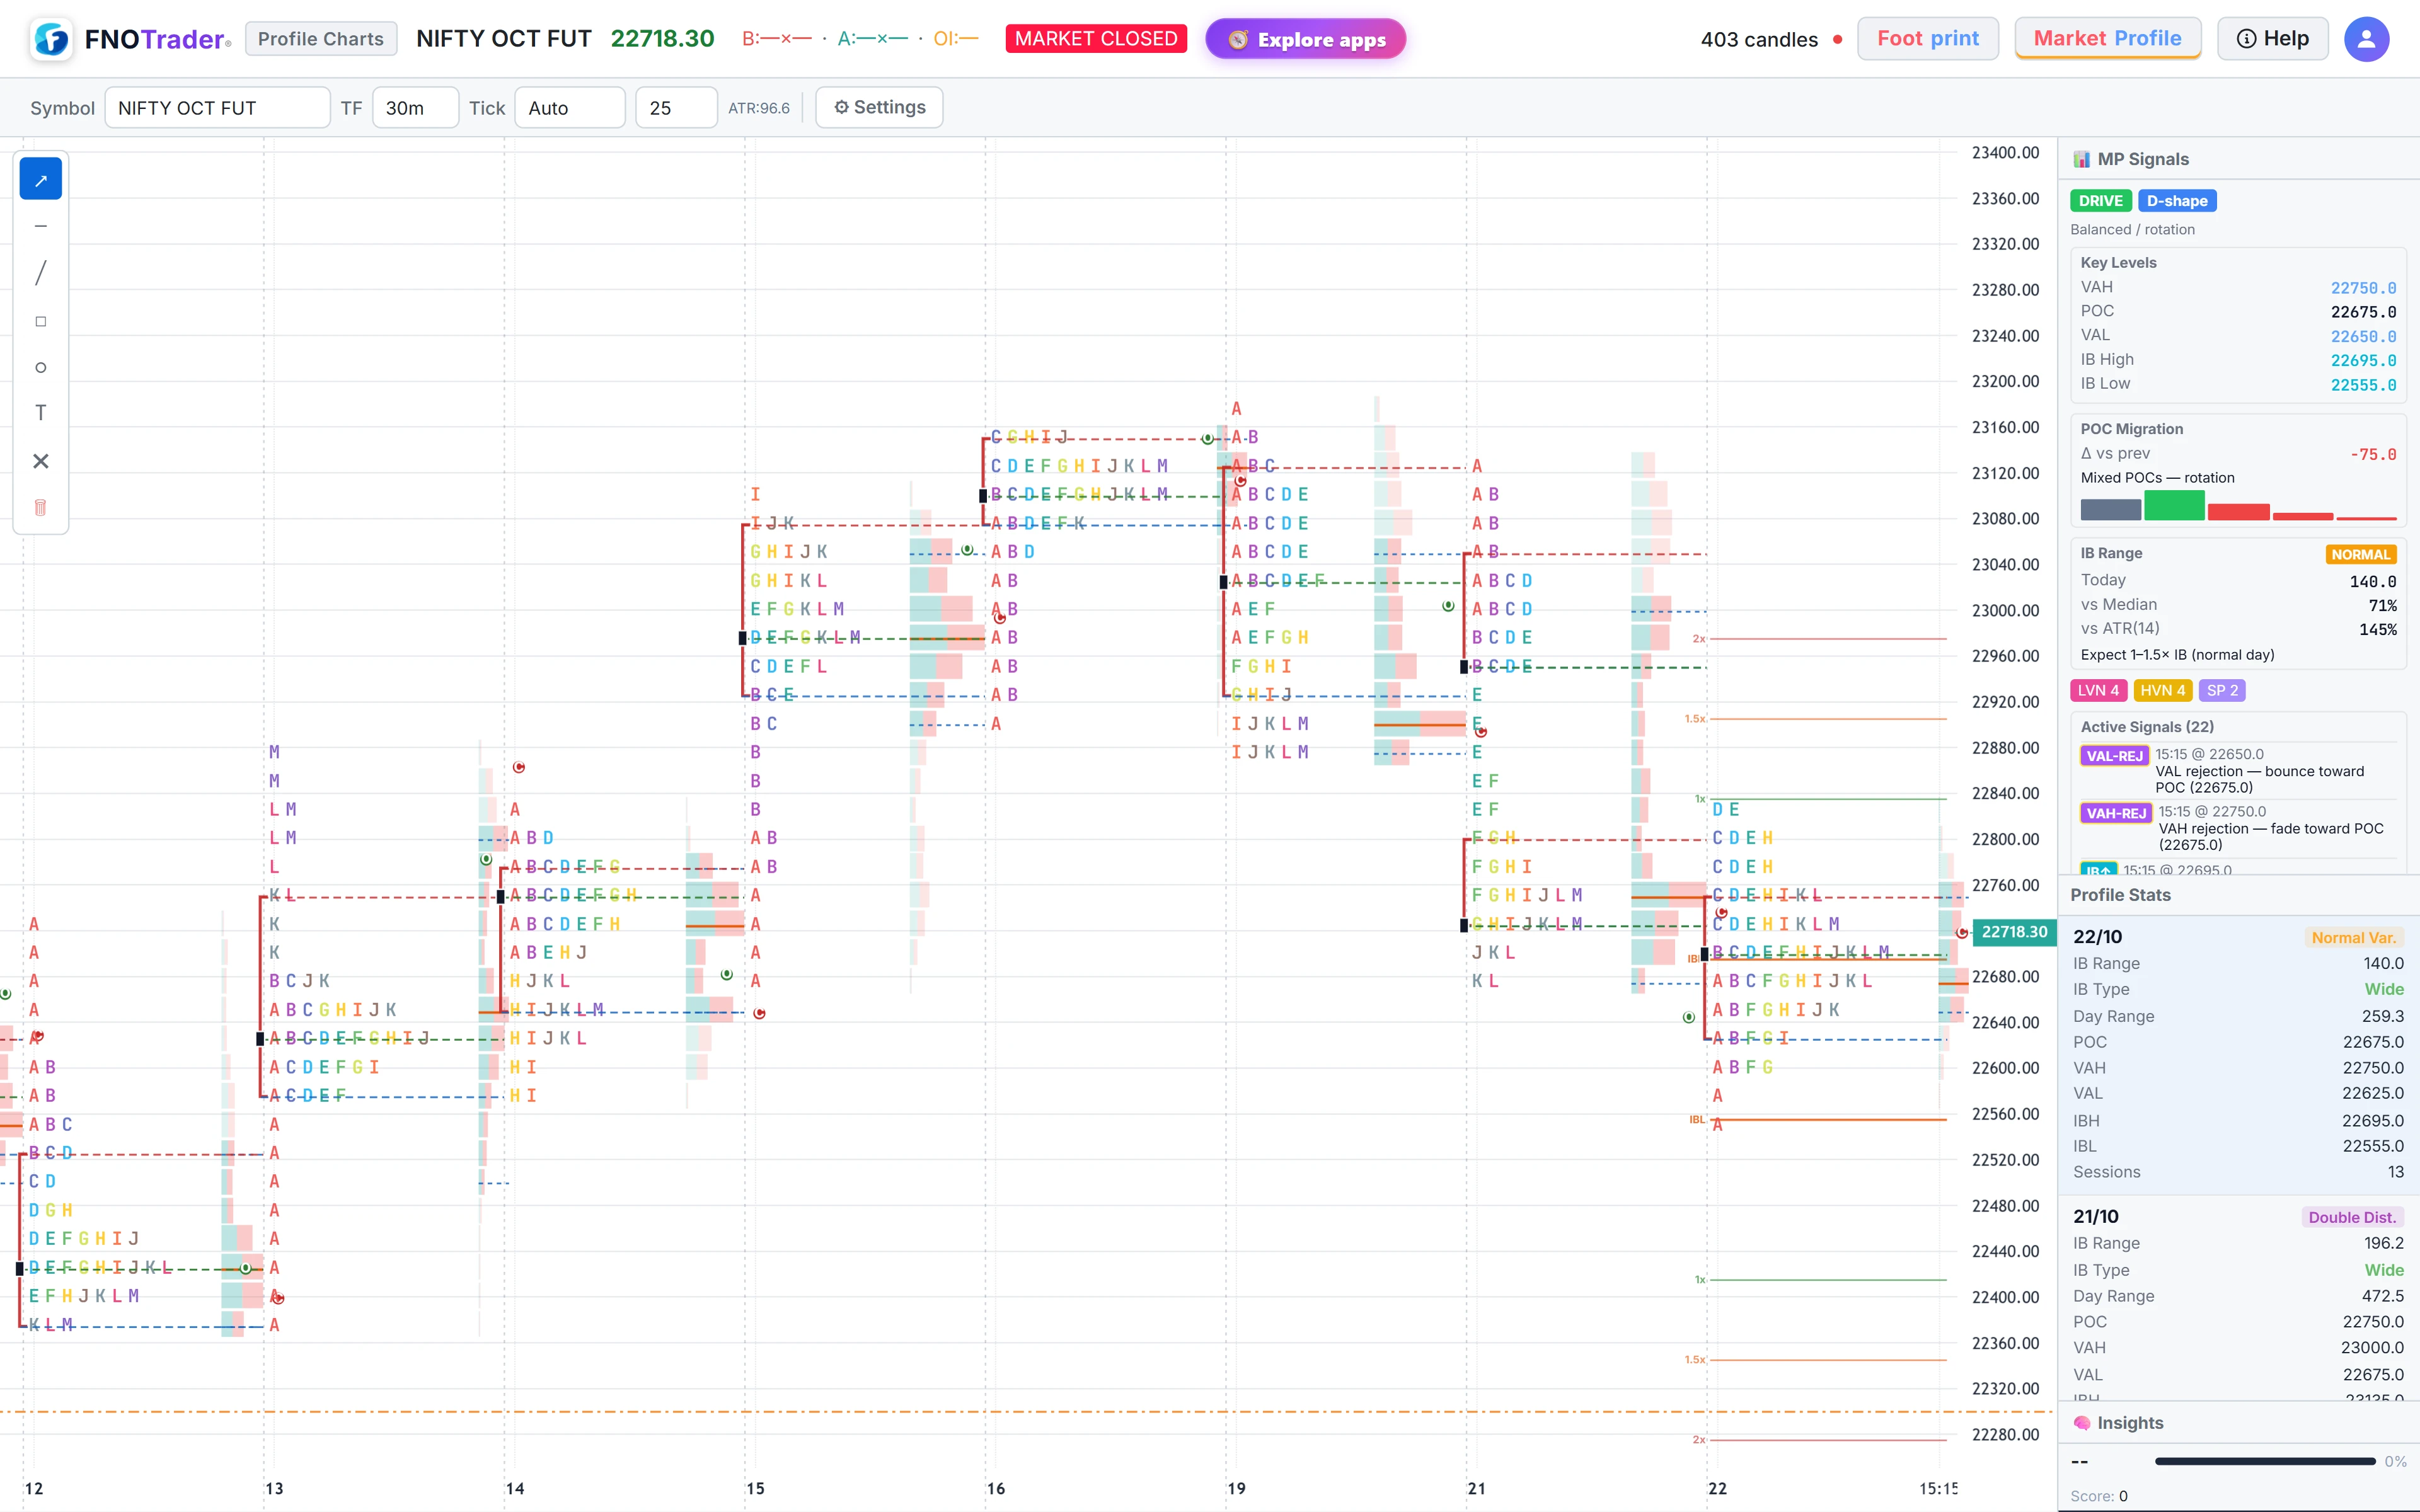
What does Volume Profile measure?
Volume Profile adds up volume traded at each price over a chosen range: a session, a week, a custom date range, or anchored from a point to now. Its high-volume and low-volume nodes show where business was done and where the market moved through quickly.
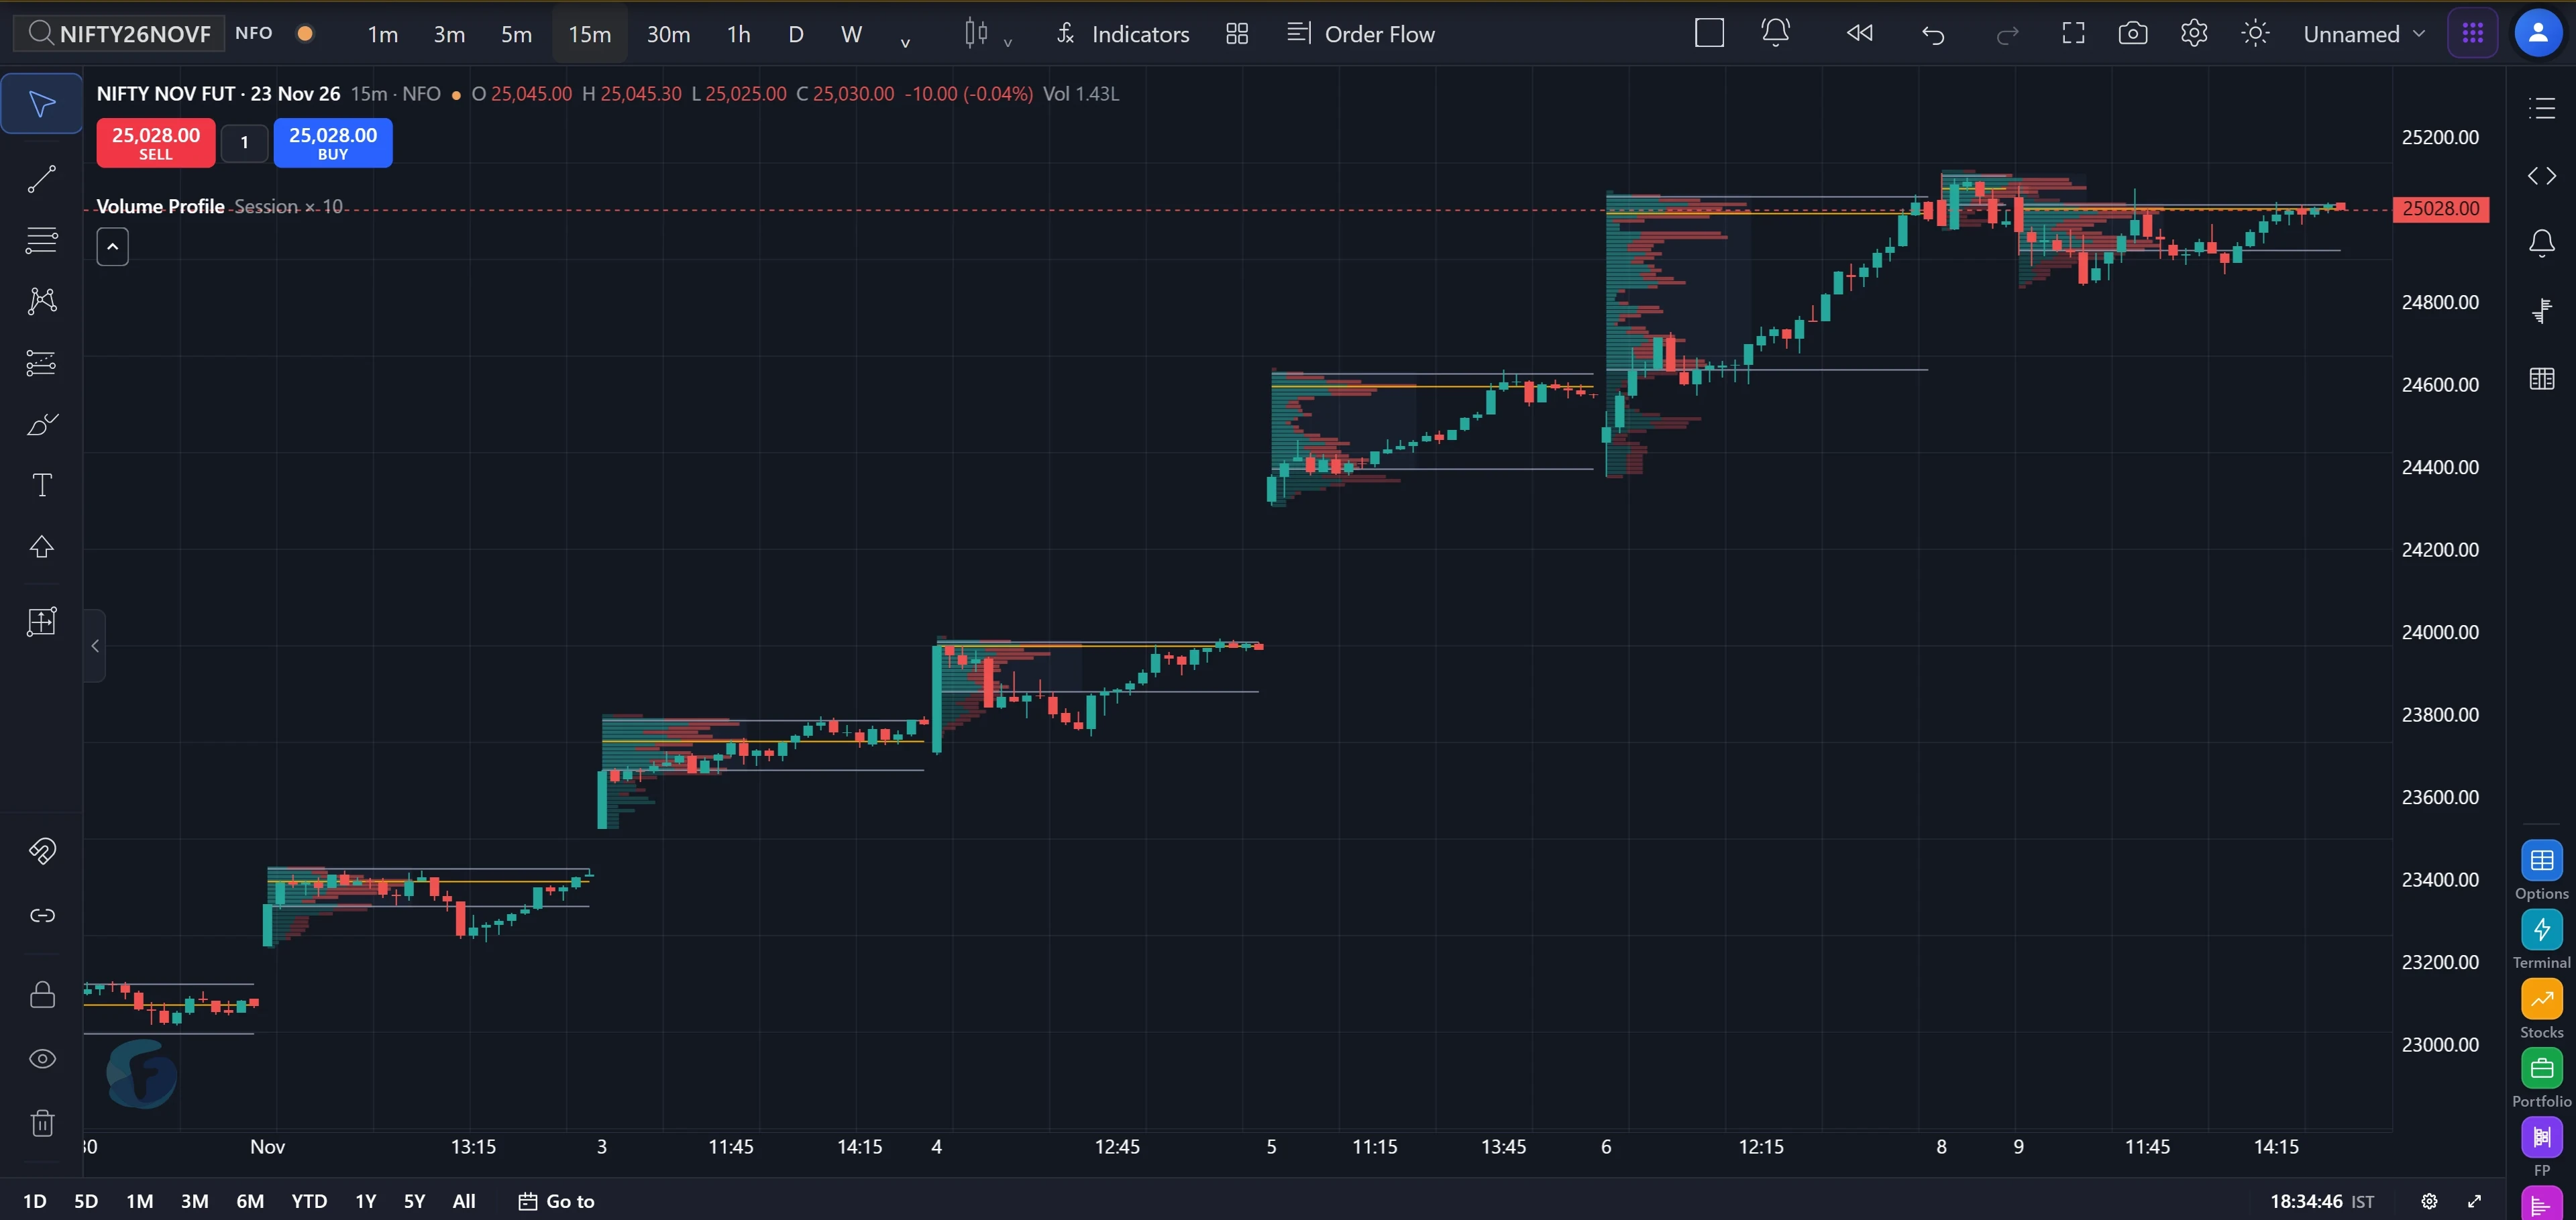
What is the POC and value area in each?
| Market Profile | Volume Profile | |
|---|---|---|
| POC | Price with the most TPOs (time) | Price with the most volume |
| Value area | Prices holding ~70% of TPOs | Prices holding ~70% of volume |
| VAH / VAL | Top and bottom of the TPO value area | Top and bottom of the volume value area |
| Built from | Time periods | Traded volume |
Hypothetical example: if a session traded 10 lakh contracts, the volume value area is the narrowest band around the POC that contains 7 lakh of them.
What does it mean when they disagree?
- Time POC above volume POC: the market spent time higher up but did its real trading lower down. Price drifted on light participation.
- A wide TPO area with a thin volume node inside it: prices were visited often but traded lightly. These areas are often passed through quickly on a revisit.
- Volume POC near a day extreme: heavy business happened at the edge of the range, which the time-based view will not emphasise.
Neither profile predicts direction. Both describe where the market accepted price and where it rejected it.
Is volume profile order flow?
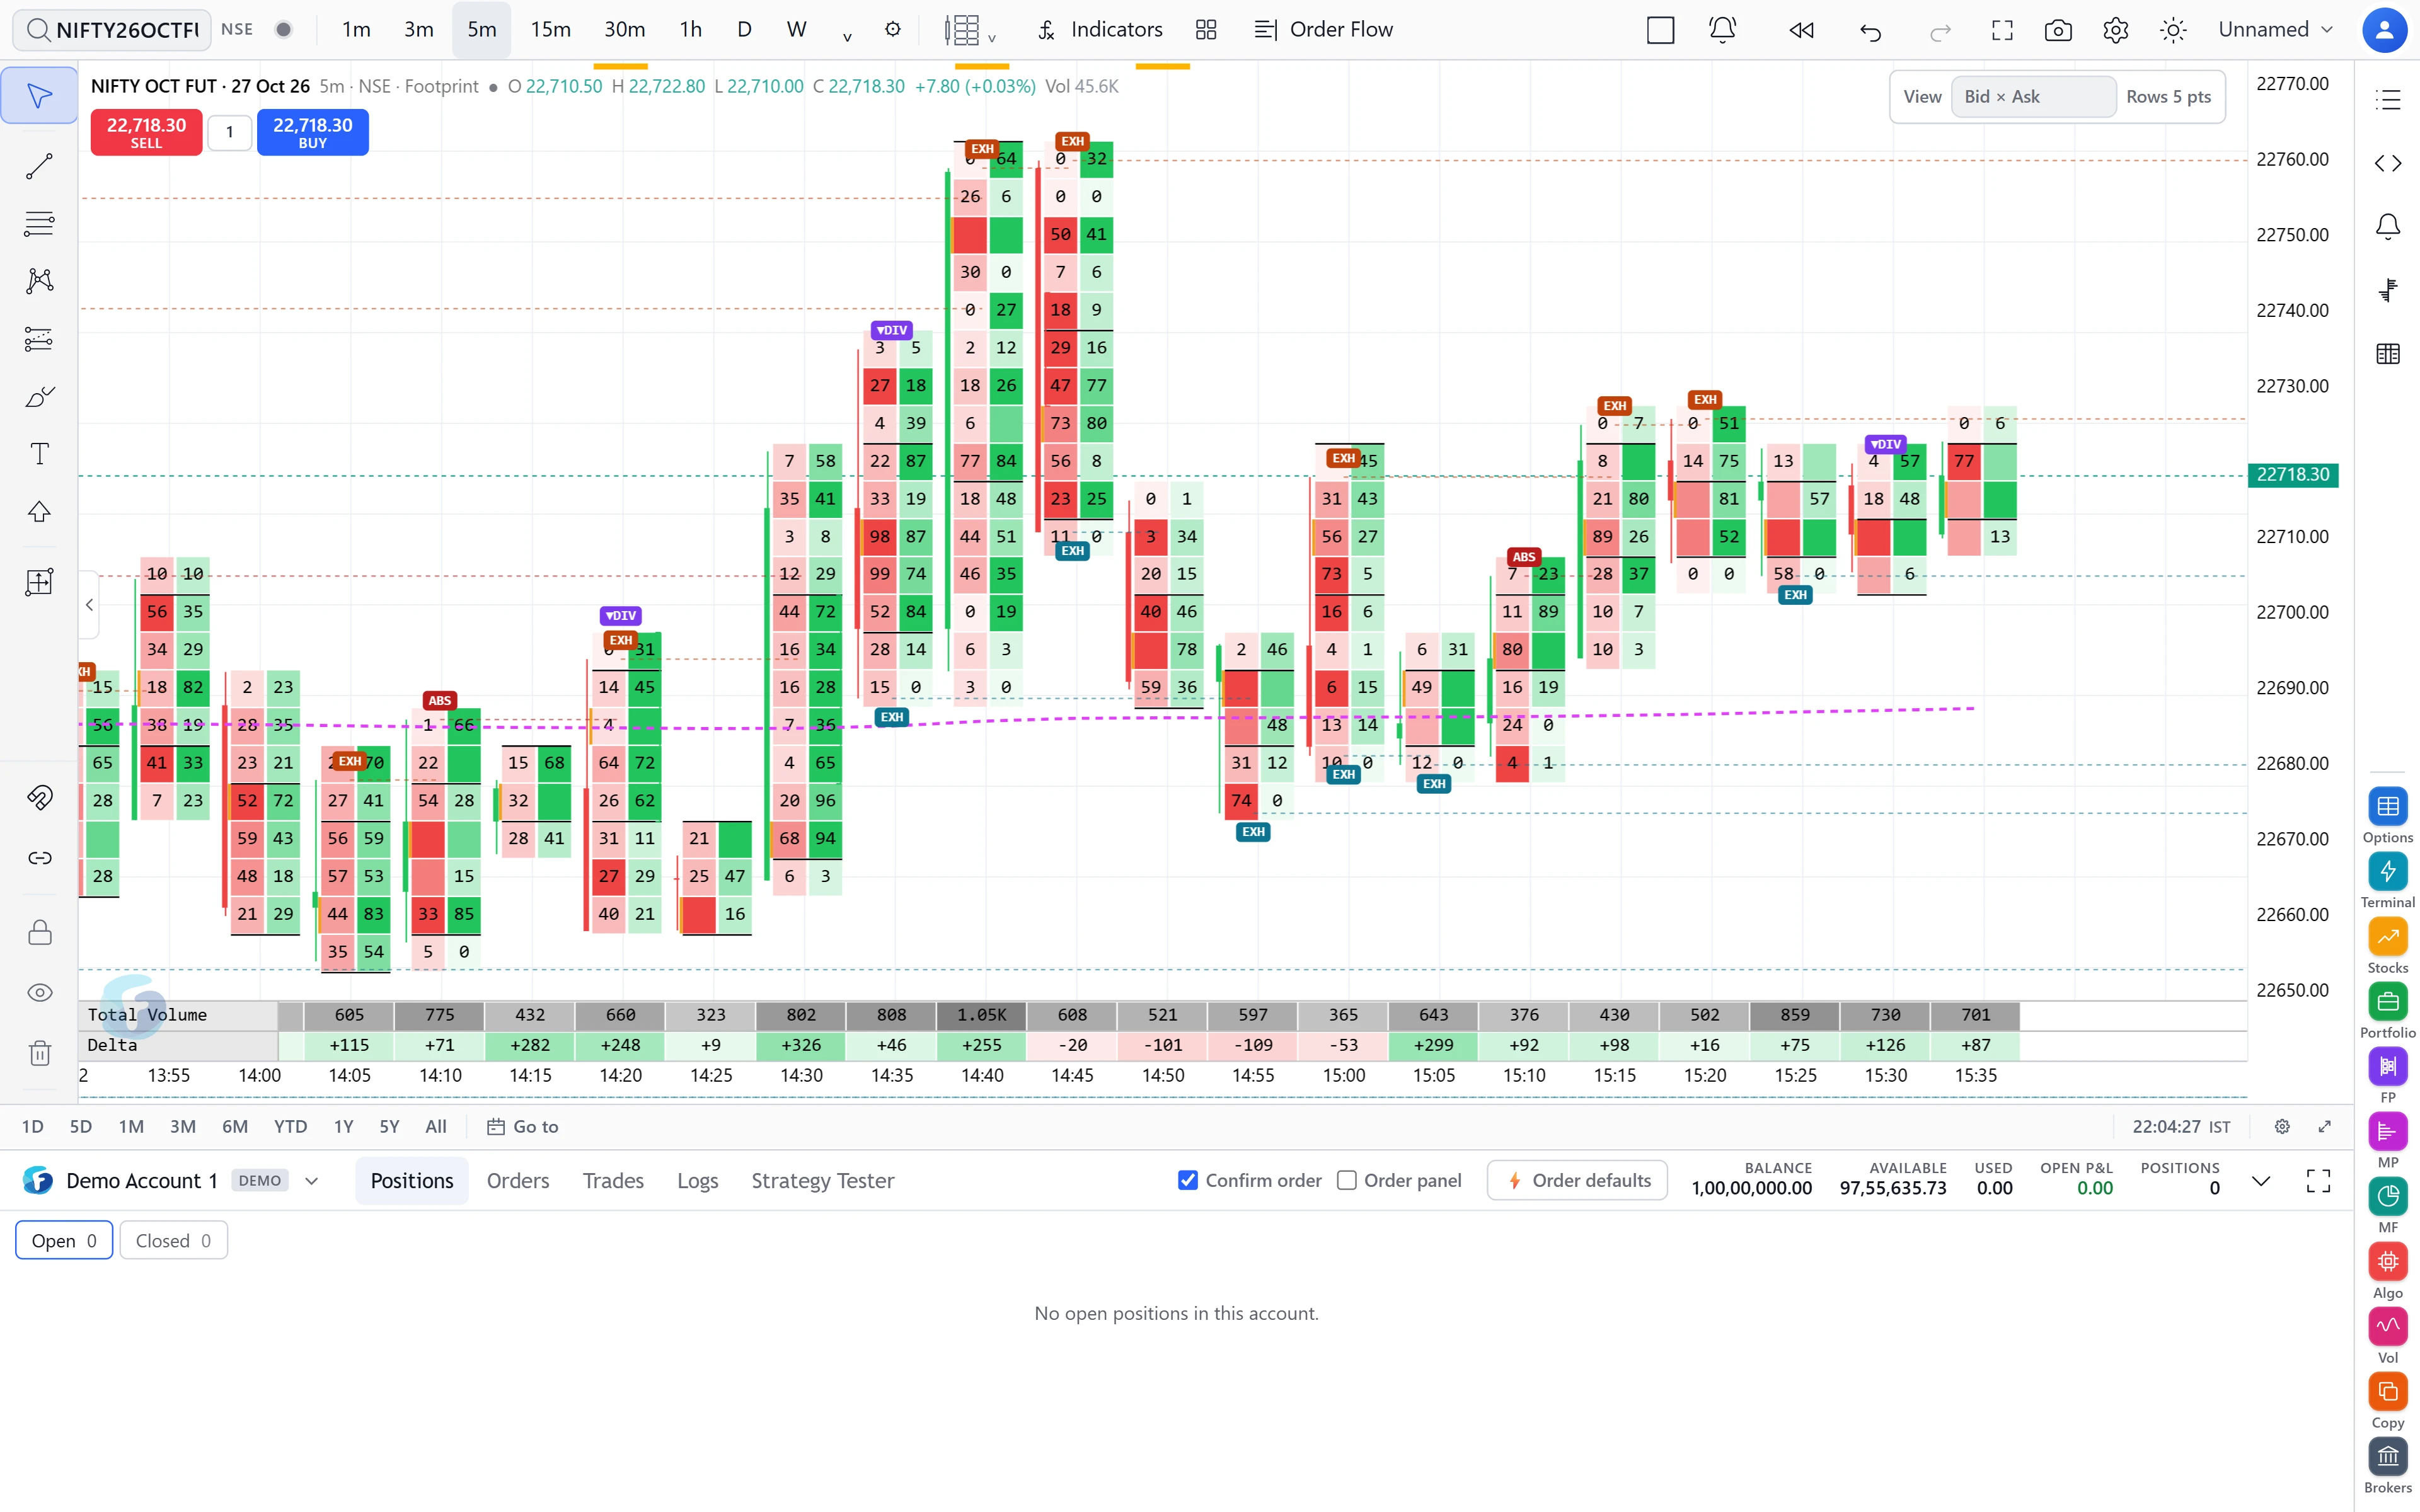
Not by itself. A candle-based Volume Profile splits up and down volume by candle direction. It does not know whether buyers or sellers were the aggressors. Aggressor information, meaning trades at the ask against trades at the bid, comes from order-flow data: footprint charts and cumulative volume delta (CVD). See footprint charts in India.
Which should I use?
- Market Profile for structure and context: was today balanced or trending, did the open drive, did the initial balance hold.
- Volume Profile for levels backed by participation, and for any range you want to draw, such as a swing or an event-to-now anchor.
- Both together when they disagree, because that is where each one adds something the other lacks.
On FNOTrader Charts, Market Profile is a chart type and Volume Profile is an indicator, so you can run both on the same chart:
- Market Profile (TPO): daily, weekly, monthly, cumulative or intraday profile periods. The default is 30-minute TPOs and a 70% value area. It marks POC, VAH, VAL, naked POCs, tails and optional initial balance. Right-click a profile to merge it with the previous one or split it.
- Volume Profile: per session, weekly, monthly, multi-day, cumulative, custom date range or anchored, with POC and value-area lines.
- Range tools: Fixed Range Volume Profile, Anchored Volume Profile and Fixed Range Market Profile (TPO), from the drawing tools' volume group.
Details are in footprint, market profile and volume profile on FNOTrader Charts.
Try it in FNOTrader Charts
Put Market Profile and Volume Profile on the same chart in FNOTrader Charts.
Educational content. Not a recommendation to buy or sell any security.
Common questions
Is market profile and volume profile the same?
No. Market Profile measures time spent at each price, and Volume Profile measures volume traded at each price. Both give a POC and value area, and the two often differ.
What is POC in market profile?
The price with the most TPO letters, meaning the price where the market spent the most time in the profile period.
What is POC in volume profile?
The price with the most traded volume in the selected range.
What are value area high and low?
The top (VAH) and bottom (VAL) of the band around the POC that holds about 70% of the profile's TPOs or volume.
Does market profile work on NIFTY and Indian stocks?
It is a way of organising price and time, so it can be drawn on any liquid instrument. Whether a particular way of trading it has worked is something to test on history, not to assume.
More on Charts & Marketplace
More in Charts & Marketplace · App: FNOTrader Charts · Definitions: glossary · All: every article