What the page shows
A straddle is a call and a put at the same strike. Its premium is CE price + PE price, and that sum is the whole position.
When you sell a straddle you collect that sum. Your profit is the amount by which it falls; your loss is the amount by which it rises. The individual legs swing much more than the pair — on a rally the call doubles while the put halves — so reading either leg alone tells you very little about whether the trade is working.
The Straddle Charts page puts the summed premium front and centre, for any strike you pick, on intervals from 1 minute to 30 minutes and over 1, 2 or 5 sessions. For the concept itself, and how it compares with a strangle, see straddle vs strangle.
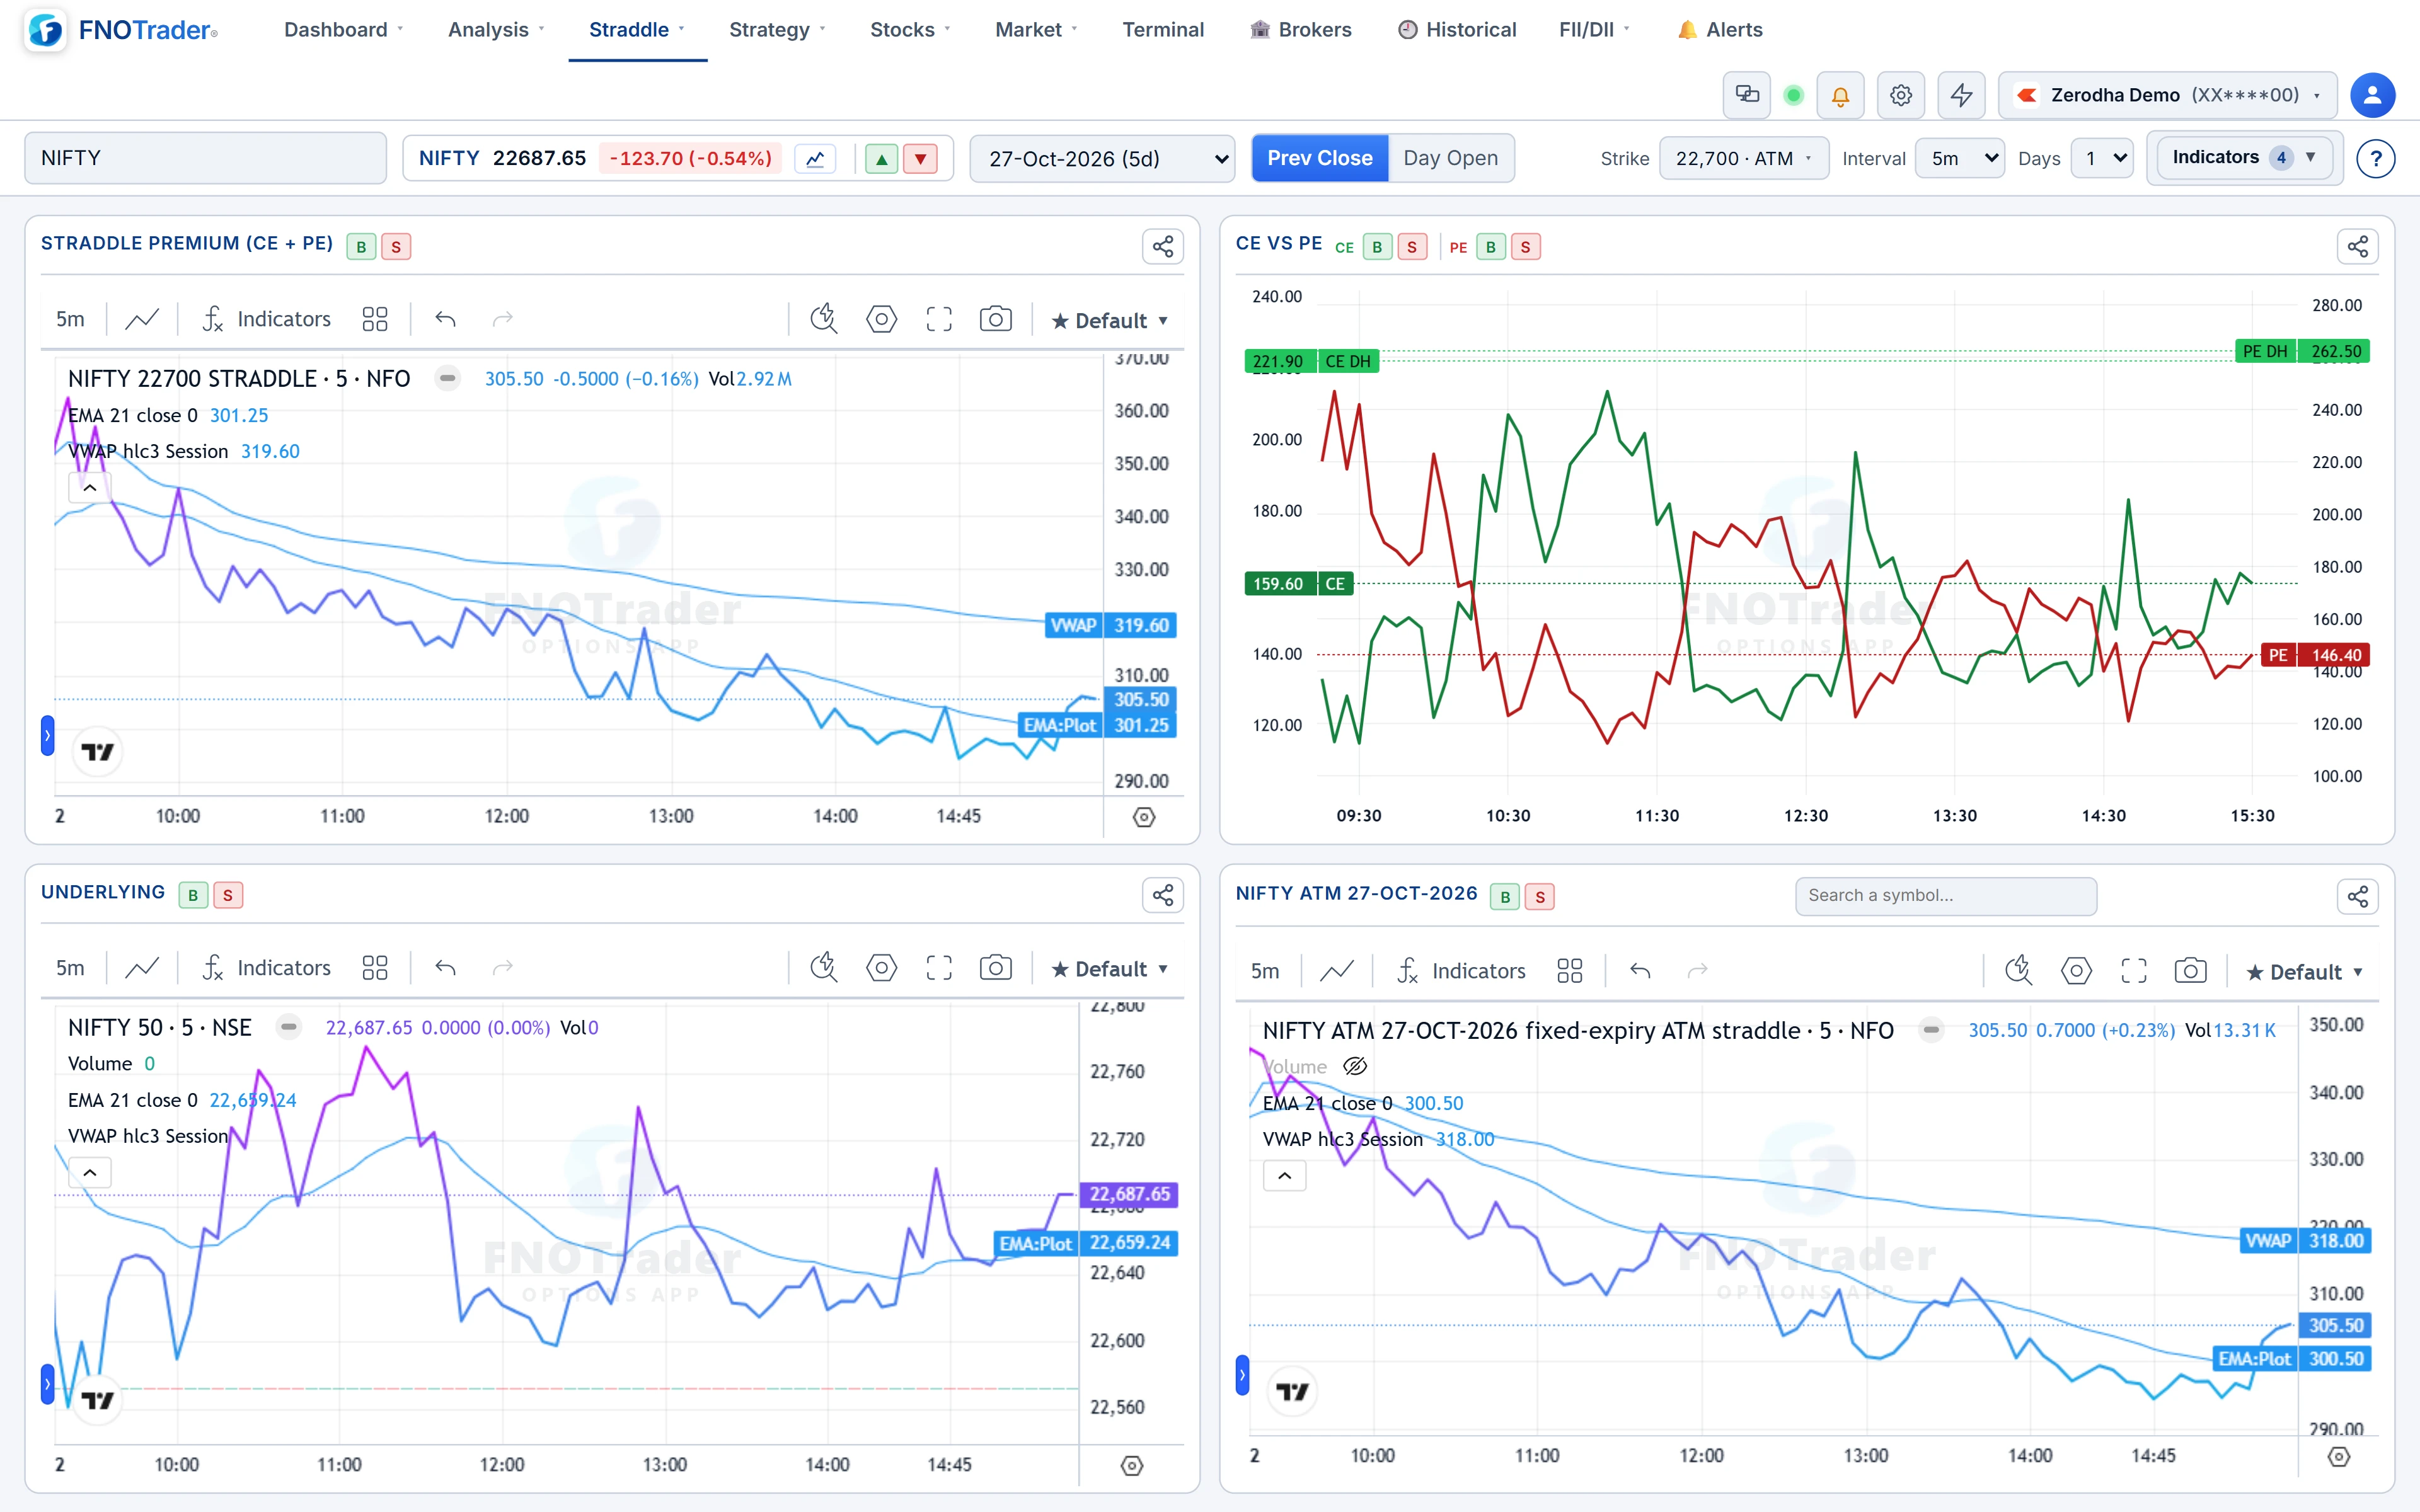
The four panes
| Pane | What it plots |
|---|---|
| Straddle Premium (CE + PE) | The sum of the two legs at the strike you chose. Line or candle. |
| CE vs PE | Both legs on one chart, so you can see which side is doing the moving. |
| Underlying | Spot, as line, candle, mountain or baseline. |
| ATM Straddle (synthetic, continuous) | The at-the-money straddle with the strike re-centred as spot moves, so it always shows the current ATM rather than the strike you started with. A search box lets you chart a different symbol here. |
The first and last panes answer different questions. The first is your position at a fixed strike. The last is the market's ATM premium — the volatility regime. If your fixed-strike straddle is rising while the rolling ATM straddle is flat or falling, the problem is that spot has moved away from your strike, not that volatility is rising.
For index underlyings the ATM pane uses a continuous ATM series. For an F&O stock, where no such series exists, it is built from the chain's ATM call and put instead.
Line or candle, and why the candles are built differently
The premium pane defaults to a line. Switch it to candles and the page fetches a combined OHLC built from tick data rather than adding up the two legs' minute candles.
That distinction matters. If you add the call's 1-minute high to the put's 1-minute high you get a number the straddle never traded at — the two highs happened at different seconds, usually on opposite sides of a price swing. Summed candles therefore show wicks that are too long. A tick-built combined candle shows the range the pair actually covered.
VWAP, EMA10, EMA20 and SuperTrend on the premium
The Indicators menu toggles four overlays independently: EMA10, EMA20, VWAP and SuperTrend. On a straddle premium they read the way they would on any price, with one inversion to keep in mind: for a seller, down is good.
- Premium below VWAP and falling means the pair has spent most of the session getting cheaper; sellers have been in control of that strike.
- Premium crossing back above VWAP is often the first sign that decay has stalled — a move, an IV rise, or both.
- EMA10 below EMA20 on the premium describes a decaying trend; a cross the other way describes expansion.
- SuperTrend flipping up on the premium marks the point a trailing stop on a short straddle would have been hit.
None of this is a signal by itself. A falling premium with spot quietly drifting toward your strike is very different from a falling premium with spot pinned — check the Underlying pane.
A worked example
Hypothetical numbers. NIFTY at 24,010 at 10:30 IST. The 24,000 call is ₹122, the 24,000 put is ₹111, so the straddle is ₹233. Session VWAP of the premium is ₹241.
- The straddle is ₹8 below VWAP — it has been cheaper than its volume-weighted average.
- At 12:00 spot is 24,060. The call is ₹146 and the put ₹82: straddle ₹228. The legs moved by ₹24 and ₹29, but the pair moved by only ₹5. That is why you chart the sum.
- By 13:30 spot is 24,190. Call ₹225, put ₹30: straddle ₹255, now above VWAP. The ATM pane, which has rolled to 24,200, may still be near its morning level — telling you the loss came from spot leaving your strike, not from a volatility spike.
Limits and common mistakes
- Days goes up to 5 sessions. For multi-day candles of a fixed strike use Straddle Charts OHLC; for the rolling ATM premium across weeks use the Rolling ATM Straddle.
- The page charts premium, not P&L. Lot size, multiple lots and costs are not applied.
- Expiry-day premiums decay fast by construction; a falling line on expiry morning is mostly time, not a read on the market. See expiry day options.
Where to find it
- Open Options Analytics and pick the symbol and expiry in the top bar.
- Go to Straddle › Straddle Charts.
- Choose the strike, interval and days; open Indicators to add VWAP, EMAs or SuperTrend.
- Use the candle/line switch on the premium pane, and the four chart types on the Underlying and ATM panes.
Common questions
What is a straddle premium chart?
A chart of the call price plus the put price at the same strike, plotted as one series through the day. It shows what a straddle position is worth without adding the legs manually.
Why use VWAP on a straddle?
VWAP shows whether the premium is trading above or below its volume-weighted average for the session. For a seller, a premium holding below VWAP means the pair has mostly been getting cheaper.
Why do summed straddle candles look wrong elsewhere?
Adding each leg's candle high and low creates wicks the pair never traded at, because the two highs happen at different moments. FNOTrader builds straddle candles from tick data instead.
What is the rolling ATM straddle pane?
It is the at-the-money straddle with the strike re-centred as spot moves, so it reflects the current ATM premium rather than a strike that has drifted away.
Does it work for stock options?
Yes. For F&O stocks the ATM pane is built from the chain's at-the-money call and put.
More on Options App
More in Options App · App: Options Analytics · Definitions: glossary · All: every article