- The short answer
- What is Market Profile in trading?
- How to read a Market Profile chart: TPO, POC, value area and IB
- Market Profile example: using yesterday's value today
- Profile shapes and day types
- Learn Market Profile step by step
- What is order flow?
- Footprint charts explained
- Delta and cumulative volume delta (CVD)
- Order flow patterns: imbalance, absorption and exhaustion
- Go deeper into order flow
- Market Profile vs Volume Profile vs order flow
- How to combine Market Profile and order flow
- Does order flow trading work?
- Market Profile and order flow on NIFTY and Indian markets
- Common mistakes
- Where to learn Market Profile and order flow
- Common questions
The short answer
Market Profile is a chart that organises a session's trading by price and time, so you can see which prices the market accepted (lots of time spent) and which it rejected (price moved through fast). Order flow is the study of the actual buy and sell orders hitting the market — which side was aggressive, at which price, and whether that aggression moved price or got absorbed.
They answer two different questions, which is why traders use them together:
| Tool | Question it answers | Typical chart |
|---|---|---|
| Market Profile | Where is fair value today, and is the market accepting or rejecting new prices? | TPO chart, value area, point of control |
| Volume Profile | At which prices did the most volume trade? | Horizontal volume histogram |
| Order flow | Who is aggressive right now, and is it working? | Footprint chart, delta, cumulative delta, DOM |
Think of Market Profile as the map and order flow as the traffic. The map tells you where the important junctions are; the traffic tells you what is happening at the junction you are standing at.
What is Market Profile in trading?
Market Profile was developed by J. Peter Steidlmayer at the Chicago Board of Trade in the 1980s. It rests on auction market theory: a market exists to facilitate trade, so it keeps moving price up and down, advertising for buyers and sellers, until it finds a price range where both sides are willing to do business. That range is “value”.
A normal candle chart hides this. A 5-minute candle shows open, high, low and close, but not how long the market spent at each price. Market Profile turns the chart sideways: price on the vertical axis, and for every time period the market traded at a price, a letter is printed at that price. Those letters are called TPOs — Time Price Opportunities.
On NIFTY the usual convention is 30-minute brackets. The 09:15–09:45 IST bracket is “A”, 09:45–10:15 is “B”, and so on through the session to 15:30 IST. Stack all the letters for the day and you get a bell-shaped (or not so bell-shaped) distribution that shows, at a glance, where the session did most of its business.
In Hindi terms people often search market profile kya hai: it is simply a way to see kis price par market ne sabse zyada time bitaya — at which prices the market spent the most time — and therefore which prices both buyers and sellers agreed were fair.
How to read a Market Profile chart: TPO, POC, value area and IB
Every Market Profile chart is built from the same handful of parts. Learn these and you can read any profile:
- TPO (Time Price Opportunity) — one letter means “the market traded at this price during this bracket”. More letters at a price means more time there.
- Point of control (POC) — the price with the most TPOs: the single fairest price of the session. If two prices tie, the one closer to the middle of the range is normally used.
- Value area (VA) — the range around the POC holding about 70% of the session's TPOs (roughly one standard deviation, borrowed from the normal distribution). Its top is the value area high (VAH) and its bottom the value area low (VAL).
- Initial balance (IB) — the range of the first hour. On NIFTY that is the A and B brackets, 09:15–10:15 IST. A move beyond the IB is called a range extension, and it tells you that a larger-timeframe trader stepped in.
- Single prints — a run of prices with only one letter. Price moved through so fast that no other bracket traded there. They mark a strong, one-sided move and often act as support or resistance later.
- Tails (excess) — single prints at the very top or bottom of the day. A buying tail at the low says sellers pushed price there and were rejected hard.
- Poor high / poor low — a flat top or bottom with several letters and no tail. The auction ended without excess, so the market often comes back to finish it.
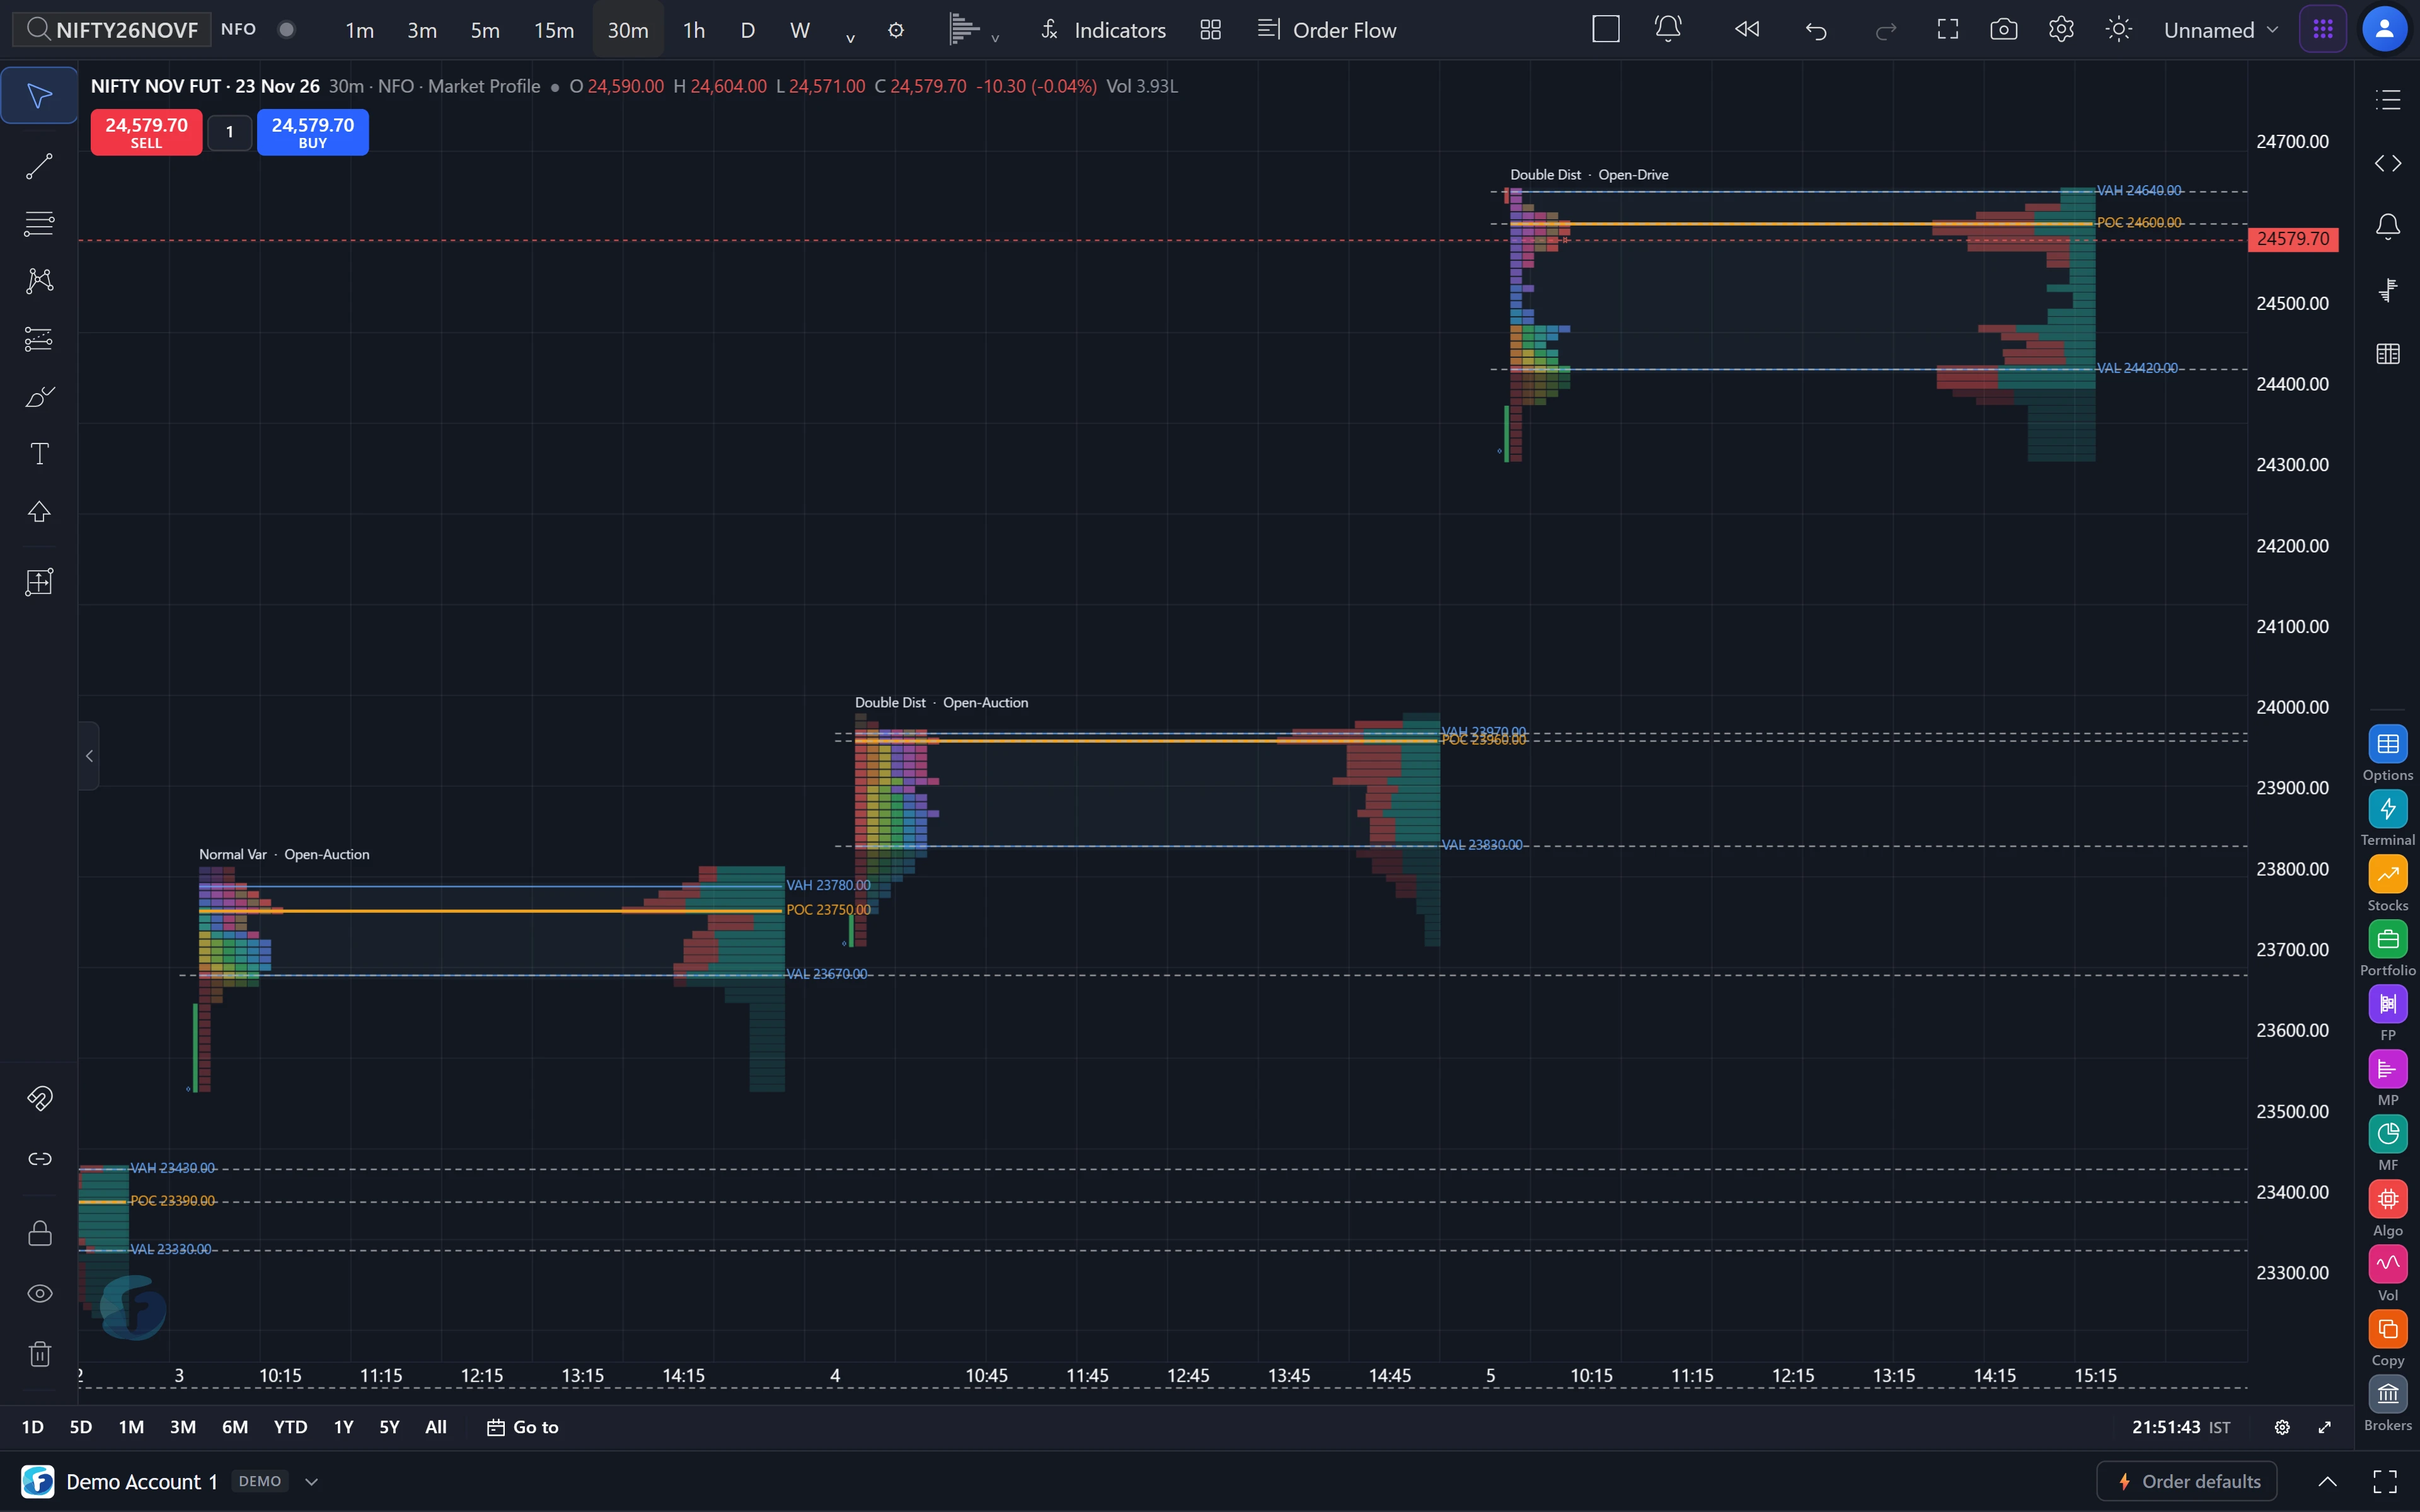
Here is a stripped-down profile so the parts are easy to see. The numbers are illustrative, not a specific day:
Read it top to bottom: the A bracket probed 24,560 and was rejected (a selling tail), the session settled into 24,500–24,540, and the fairest price was 24,520. Late in the day sellers pushed to 24,470 but left a tail there too. That is a balanced day: both extremes rejected, value in the middle.
Market Profile example: using yesterday's value today
The most practical use of Market Profile is not the shape of today — it is how today opens relative to yesterday's value area. Four cases cover most mornings:
| Where today opens | What it suggests | What traders watch for |
|---|---|---|
| Inside yesterday's value | Balance; the market still agrees with yesterday's prices | Rotation between VAH and VAL; fading the edges |
| Above VAH, and holds | Buyers accepting higher prices | Pullbacks to VAH holding as support; range extension up |
| Below VAL, and holds | Sellers accepting lower prices | Rallies to VAL failing; range extension down |
| Outside value, then back inside | Rejection of the new prices | The “80% rule”: a move across to the other side of value |
The 80% rule says that if price opens outside the prior value area and then spends two consecutive 30-minute brackets back inside it, there is a high chance it travels to the other side of value. It is one of the most searched Market Profile setups — and, like every single rule, it is not an edge on its own. When we tested the mechanical version on a year of NIFTY sessions for our Market Profile course, it did not hold up without context (trend, the overnight gap, where the larger-timeframe value sits). Treat rules like this as a description of what usually happens, then use order flow to check whether it is happening today.
Profile shapes and day types
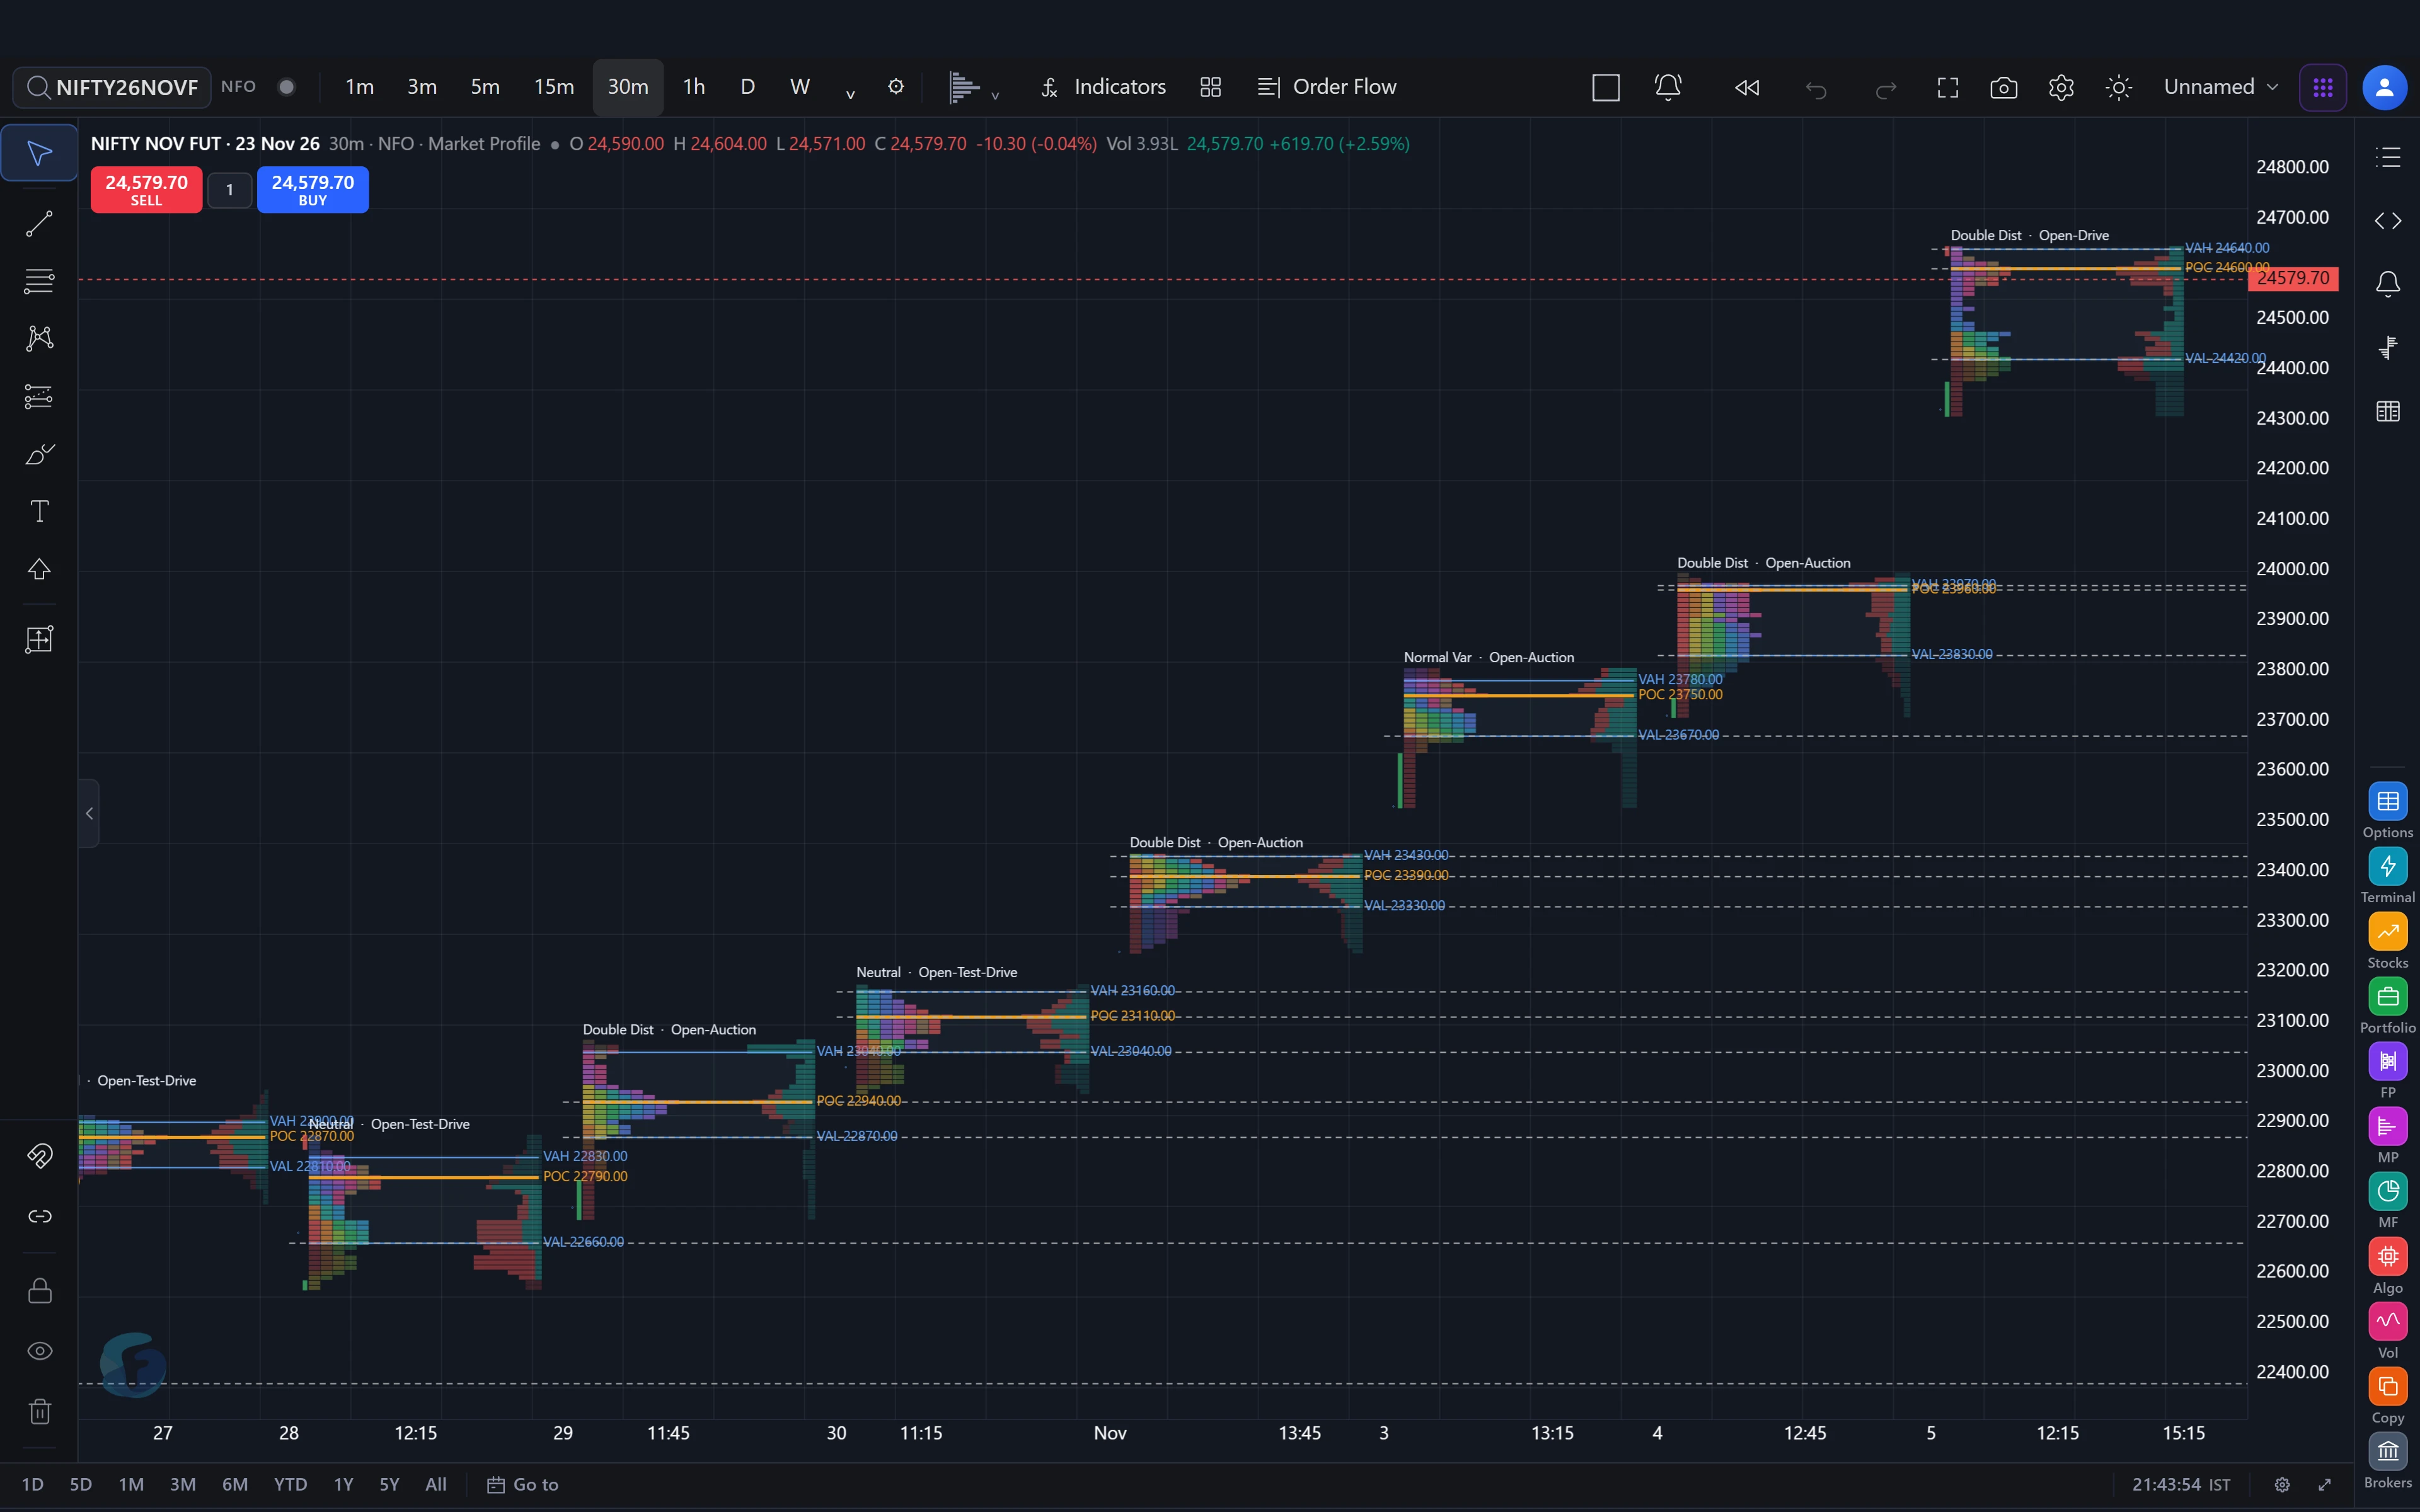
The overall shape of the profile tells you what kind of auction the day was. The names come from Steidlmayer and James Dalton's work and are used the same way on NIFTY:
- Normal day — a wide initial balance that holds all day. Large players set the range early and nobody breaks it.
- Normal variation — a range extension on one side, roughly up to double the IB. The most common day type.
- Trend day — a narrow IB followed by steady extension in one direction, with the close near the extreme and value migrating all day. Fading a trend day is the classic expensive mistake.
- Double distribution — two separate value areas joined by single prints: the market accepted one range, then something changed and it moved to a new one.
- Neutral day — range extension on both sides of the IB. Who wins is decided by where it closes.
- P-shape and b-shape — a fat top with a thin tail below (P, short covering or buying) or a fat bottom with a thin tail above (b, long liquidation or selling).
Naming the day type early — usually by 11:00–11:30 IST on NIFTY — is what decides whether you trade the edges back to the middle or go with the break.
Learn Market Profile step by step
Market Profile is easy to read once and hard to read well. The jump from naming the parts to using them in a live session is mostly practice on real days: which open types follow through, what a poor high looks like before it gets repaired, how composites over several days change the picture.
FNOTrader School · CourseMarket Profile Mastery — learn to read the auction on NIFTYBuild a TPO chart by hand, then read value, day types, opens, composites and a full-session trading plan. Every example is a real NIFTY session, shown on FNOTrader’s own Market Profile chart.12 modules48 lessons63 animated visuals75 quiz questionsSee the course →What is order flow?
Order flow is the stream of buy and sell orders that actually get executed. Every trade has a buyer and a seller, so “more buyers than sellers” is not literally true. What differs is who was aggressive:
- A passive trader places a limit order and waits in the order book.
- An aggressive trader sends a market order (or a marketable limit) that takes the waiting liquidity.
When aggressive buyers lift the offers faster than sellers replenish them, price ticks up. When aggressive sellers hit the bids, price ticks down. Order flow analysis is reading that contest: who is initiating, how much, at which price, and whether price actually moves because of it.
That last part is the key to how order flow works in practice. Heavy aggressive selling that does not push price lower means a large passive buyer is absorbing it — and that is often the first clue that a move is about to turn. A candle chart cannot show this; order flow can.
The main order flow tools are the footprint chart, delta and cumulative volume delta, the depth of market (DOM) or price ladder, and time and sales (the tape).
Footprint charts explained
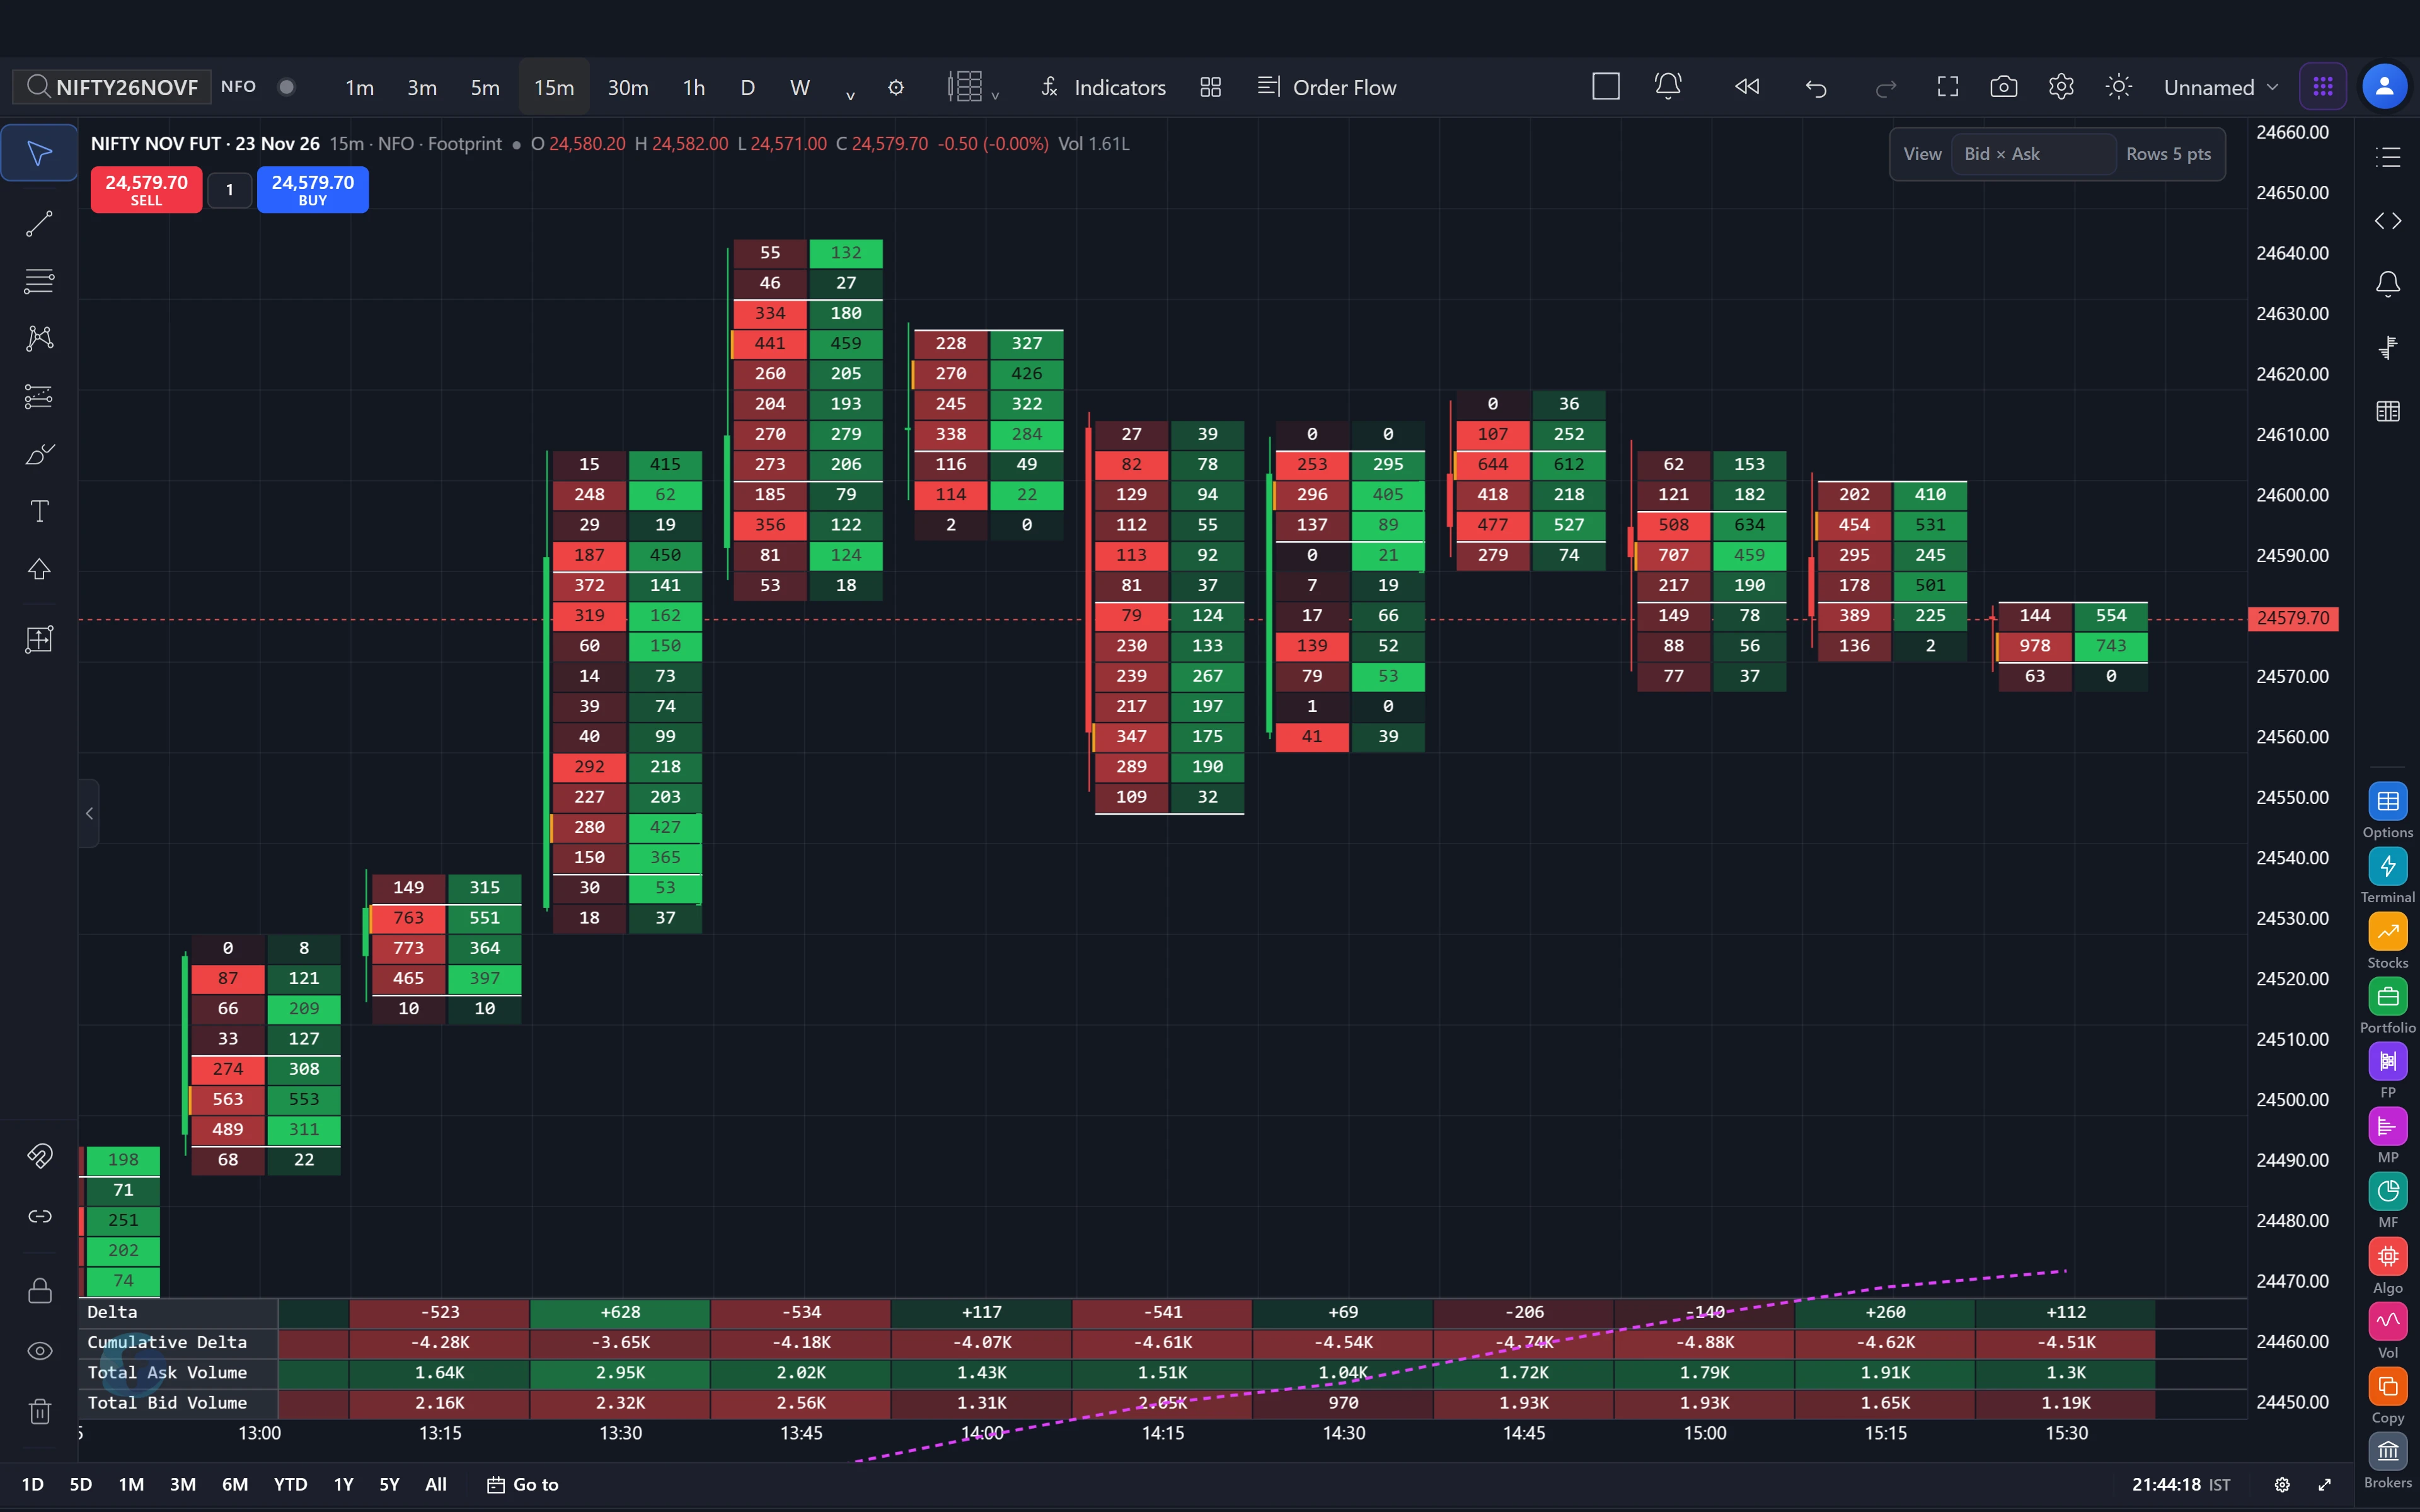
A footprint chart splits every candle into price rows and prints the volume that traded at each row, separated into selling and buying. Instead of one candle body you see something like this for a single 5-minute NIFTY futures bar (illustrative numbers, in lots):
From that one bar you can read where volume concentrated (24,525), whether buyers or sellers did more of the initiating, and how the bar's extremes behaved — thin volume at the high and low means price was quickly rejected there.
Common ways of drawing it are bid x ask (two numbers per row), delta (buy minus sell per row) and volume profile per bar. If you are setting one up, our guide to footprint views and row size covers why the row size changes everything you conclude.
A note on Indian data. NSE does not publish which side initiated each trade, so every footprint on Indian futures classifies trades from the feed itself — a trade at a higher price than the previous one counts as buying, at a lower price as selling. It is a good estimate, not a perfect record, and it is why footprint numbers can differ between two platforms.
Delta and cumulative volume delta (CVD)
Delta is buying volume minus selling volume. The formula is simply:
delta = volume classified as buying − volume classified as selling
It can be calculated per price row, per bar, or for the whole session. A bar with 1,800 lots bought and 1,200 sold has a delta of +600.
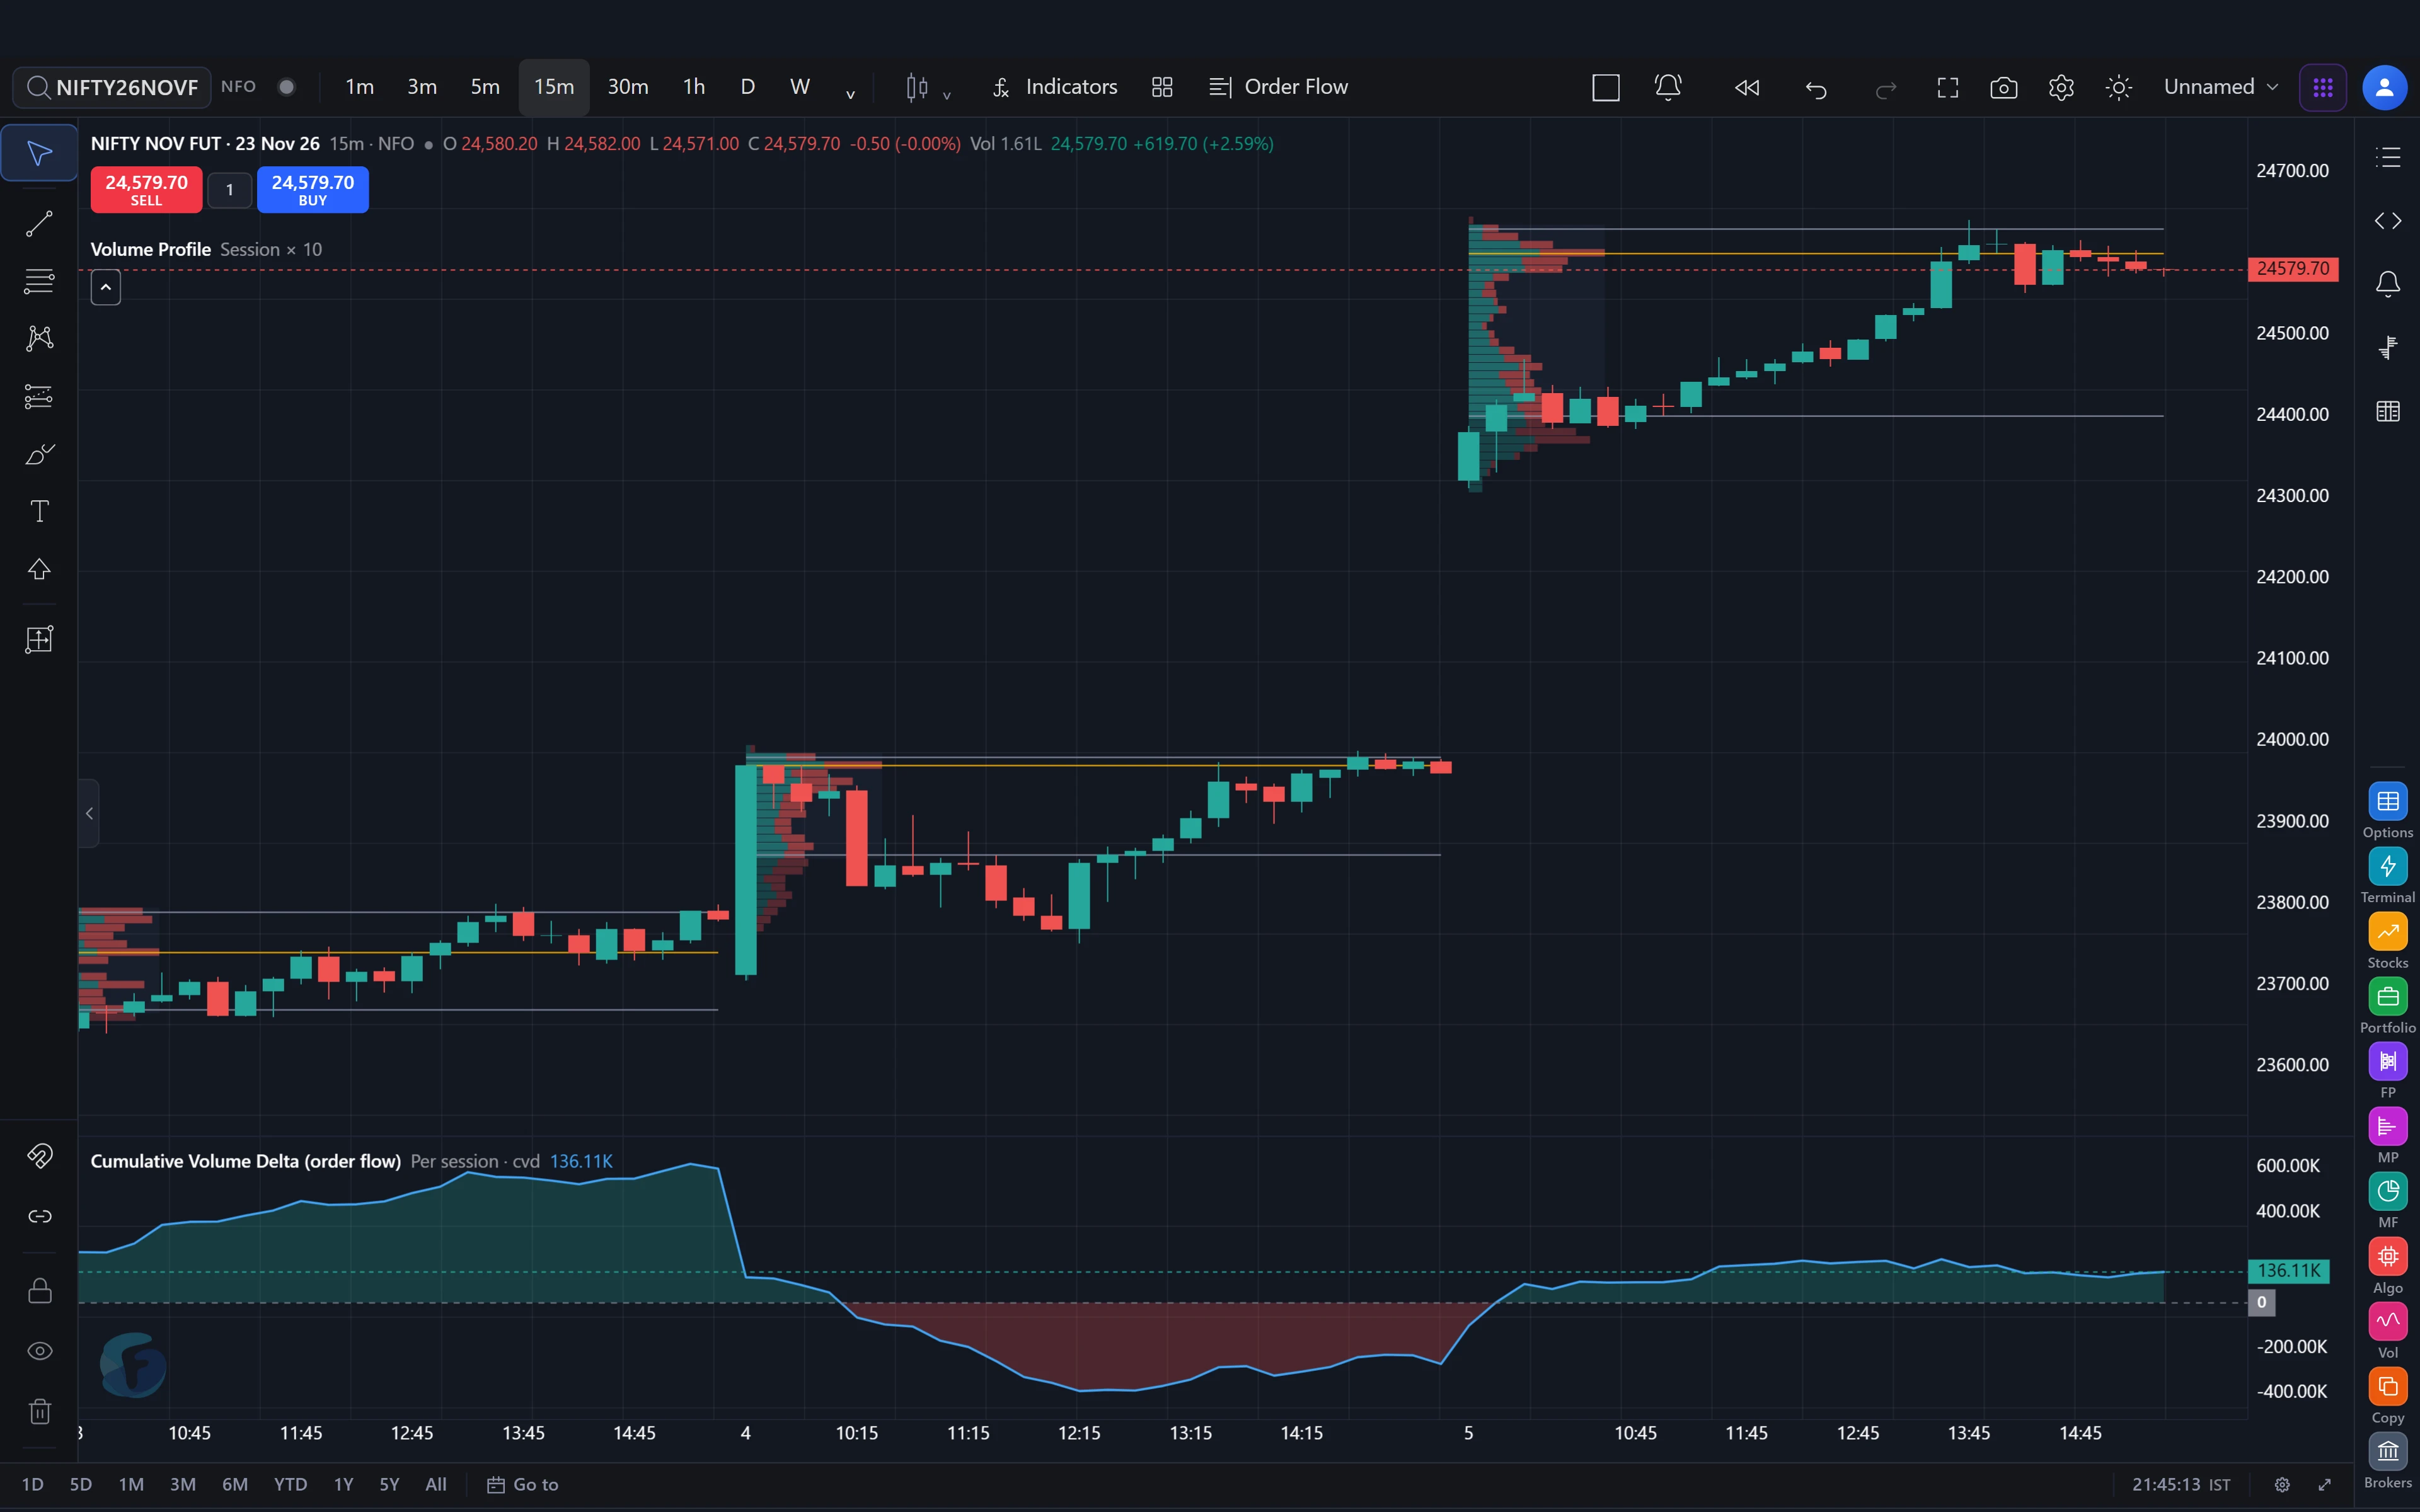
Cumulative volume delta (CVD) is the running total of delta through the session. It is usually drawn as a line under the price chart. Rising CVD means buyers have been the more aggressive side over time; falling CVD, sellers.
The useful signals come from comparing CVD with price:
- Agreement — price makes a new high and CVD makes a new high: the move is being driven by aggressive buying.
- Cumulative delta divergence — price makes a new high but CVD does not. Buyers are no longer pushing; the high may be a passive-seller wall or short covering running out.
- Absorption — CVD falls hard while price holds flat. Aggressive sellers are being soaked up by a passive buyer.
CVD should be anchored to the session (reset at 09:15 IST on NSE). A CVD that runs for days mixes overnight positioning with today's flow and becomes hard to read.
Order flow patterns: imbalance, absorption and exhaustion
Most order flow setups are built from four patterns:
- Imbalance — at one row, aggressive buying is at least 2× to 3× the aggressive selling one row below (compared diagonally, because buyers lift the offer above where sellers hit the bid). Three or more in a column, a stacked imbalance, often marks a level the aggressor defends later. More in our imbalance guide.
- Absorption — large aggressive volume at a price that does not move. A passive order is taking everything thrown at it.
- Exhaustion — volume dries up at the extreme of a move: the last buyers have bought, and there is nobody left to push.
- Unfinished auction — a bar's high or low with volume on both sides, rather than tapering to almost nothing. Like a poor high on a profile, price tends to revisit it.
For how these look on real charts, see absorption, exhaustion, tails and divergence.
Go deeper into order flow
Order flow is the most practical skill of the two and the easiest to get wrong — imbalances appear everywhere, and most of them mean nothing. What matters is where they appear (at value-area edges, prior POCs and single prints) and what happens next.
FNOTrader School · CourseThe Order Flow Course — footprint, delta and ten defined setupsFrom how the matching engine fills an order to absorption, exhaustion, liquidity sweeps, sizing and a tested personal system — built on NIFTY futures and options with Indian market data as it really is.12 modules51 lessonsvideo + text60 quiz questionsSee the course →Market Profile vs Volume Profile vs order flow
These three get mixed up constantly, so here is the difference in one table:
| Market Profile (TPO) | Volume Profile | Order flow | |
|---|---|---|---|
| Built from | Time at each price | Volume at each price | Aggressive buying vs selling at each price |
| Main output | POC, value area, IB, day type | Volume POC, high/low volume nodes | Delta, CVD, imbalances, absorption |
| Timeframe | Session and multi-day context | Any range: day, swing, visible range | Bar by bar, minute by minute |
| Best for | Where to trade | Where volume is concentrated | When to trade, and whether a level is holding |
Market Profile vs Volume Profile: both build a horizontal distribution, but one counts time and the other counts volume. They usually agree; when they don't — say a price where the market spent little time but a lot of volume changed hands — that disagreement is itself information about where large orders sat. “TPO chart vs Volume Profile” is the same comparison.
Order flow vs price action: price action reads candles, patterns and swings. Order flow reads the trades inside those candles. A bullish engulfing candle with negative delta is a very different thing from one with strong positive delta; price action alone cannot tell them apart.
Order flow vs ICT / SMC: ICT and smart-money concepts talk about “order blocks” and “liquidity” inferred from candle shapes. Order flow measures them from executed volume. The ideas overlap — stop runs, liquidity sweeps, institutions defending a level — but order flow lets you check whether the volume was actually there.
How to combine Market Profile and order flow
The workflow most order flow traders use is: profile for location, order flow for timing.
- Before the open, mark yesterday's VAH, VAL and POC, any single prints and poor highs or lows, and the multi-day composite value. These are your levels; nothing else gets traded.
- At the open, note where NIFTY opens relative to that value (inside, above, below) and how the first 30 minutes behave. That sets your expectation for the day type.
- At a level, switch to the footprint. Is aggressive selling into VAL being absorbed? Is CVD diverging at the high? Did a stacked imbalance appear as price left the level?
- Enter only when both agree — the location says “this level matters” and the flow says “the other side is failing here”. Place the stop where the order flow idea is proven wrong (beyond the absorption, beyond the imbalance), not at an arbitrary number of points.
- Manage with the profile: the next value-area edge or POC is the natural first objective.
A point of control trading strategy or value area trading strategy is usually just step 3 applied to one level: price returns to yesterday's POC, and you take the trade only if the footprint shows the defence.
Does order flow trading work?
Honestly: order flow is a way to read the market, not a strategy that prints money. It helps most traders in three concrete ways — tighter, more logical stops; fewer trades taken against obvious absorption; and earlier recognition that a breakout is failing. It does not remove losing trades.
Three things decide whether it works for you:
- Context first. An imbalance in the middle of a balanced range is noise. The same imbalance at a prior value-area edge is a signal.
- Consistent settings. Row size and imbalance ratio change what you see. Fix them, then judge days against each other.
- Costs and testing. Intraday NIFTY futures and options trading carries brokerage, STT, exchange charges and slippage. Write your setup down, test it on past sessions, and size so that a normal run of losses does not take you out.
Market Profile and order flow on NIFTY and Indian markets
A few India-specific points that most global material skips:
- Use futures for order flow, spot or futures for TPO. NIFTY spot is an index and has no traded volume of its own, so volume, delta and footprint come from NIFTY futures. Market Profile (time-based) works on either.
- Session times. NSE equity and F&O trade 09:15–15:30 IST; that defines the brackets, the IB (09:15–10:15) and the CVD reset. MCX runs 09:00–23:30 IST, so its profiles look very different.
- Expiry. Weekly expiry days distort options flow and often the futures too; many traders treat them as their own day type.
- Contract roll. Volume on the current-month future fades in the last days before expiry as positions move to the next month. Footprint and profile from a thinning contract need care.
- Broker vs charting. Searches like footprint chart Zerodha or order flow on Dhan are really asking where to get these charts. Order flow charts come from the exchange feed, not from your broker, so you can read them on FNOTrader Footprint or FNOTrader Charts and still trade through the broker you already use.
Common mistakes
- Trading every imbalance. They print all day. Without a level, they are noise.
- Fading a trend day. Narrow IB, early range extension, value migrating with price — that is not the day to sell the high “because it is above value”.
- Changing row size mid-session. The footprint and the imbalances change with it, and you end up comparing different charts.
- Reading spot volume. An index has no volume; any “volume” on NIFTY spot is borrowed or synthetic. Use futures.
- Treating rules as edges. The 80% rule, open-drive, narrow-IB breakout: all are descriptions of what often happens. Test them before you trust them.
Where to learn Market Profile and order flow
The classic books are Steidlmayer's own work, James Dalton's Mind Over Markets and Markets in Profile for Market Profile, and a range of futures-market books for order flow. They are written on US futures. The two FNOTrader School courses teach the same ideas on Indian markets — NIFTY sessions, NSE times and expiries, and the footprint and profile charts you can open today. The start-here lessons of both are free to read.
Related reading: TPO, value area and initial balance in the app · open types and day types · footprint charts in India · CVD and time and sales.
Common questions
What is Market Profile in trading?
Market Profile is a chart that shows how much time the market spent at each price during a session. Each 30-minute period that trades at a price prints a letter (a TPO) there. The result shows the point of control (the fairest price), the value area (about 70% of the activity) and whether new prices were accepted or rejected.
What is order flow trading?
Order flow trading means making decisions from the executed buy and sell orders rather than from candle patterns alone — which side was aggressive, at which price, and whether that aggression moved price or was absorbed. The main tools are the footprint chart, delta, cumulative volume delta and the depth of market.
What is the difference between Market Profile and Volume Profile?
Market Profile measures time spent at each price (TPOs); Volume Profile measures volume traded at each price. Both give a point of control and a value area and usually agree. Where they disagree, it shows prices where large volume traded quickly.
What is cumulative volume delta?
Cumulative volume delta (CVD) is the running total of buying volume minus selling volume through the session. Rising CVD means aggressive buyers dominate; a new price high without a new CVD high is a divergence that warns the move is losing support.
What is a point of control (POC)?
The point of control is the price with the most activity in a profile — most TPOs in Market Profile, most volume in Volume Profile. It is the session's fairest price and often acts as a magnet or a reaction level on later days.
What are value area high and value area low?
The value area is the range around the POC that holds about 70% of the session's activity. Its upper edge is the value area high (VAH) and its lower edge the value area low (VAL). Where the next day opens relative to them is one of the most used Market Profile reads.
Market profile kya hai? / Order flow kya hai?
Market Profile batata hai ki market ne kis price par sabse zyada time bitaya — wahi fair value hai. Order flow batata hai ki har price par aggressive buyers zyada the ya sellers, aur unki wajah se price hila ya nahi. Dono saath mein: profile se level, order flow se entry ka timing.
Does order flow trading work on NIFTY?
It works as a way of reading the market — better stops, fewer trades against absorption, earlier warning of failed breakouts — not as a standalone money-making rule. Use NIFTY futures for volume and delta, fix your settings, and test any setup on past sessions with costs included.
Can I use order flow and Market Profile with Zerodha or Dhan?
Footprint and profile charts are built from the exchange feed, not from the broker. You can read them on FNOTrader Footprint or Charts and place orders through a connected broker account such as Zerodha or Dhan.
Is there a Market Profile or order flow course for Indian markets?
Yes. FNOTrader School has Market Profile Mastery (12 modules, 48 lessons on NIFTY) and The Order Flow Course (12 modules, 51 lessons on NIFTY futures and options). The start-here lessons of both are free at learn.fnotrader.com/course.
More on Footprint & Market Profile
More in Footprint & Market Profile · App: Footprint & Market Profile · Definitions: glossary · All: every article